29
/fr/
fr
AIzaSyAYiBZKx7MnpbEhh9jyipgxe19OcubqV5w
April 1, 2024
235498
Senegal
SEN
true
2
1
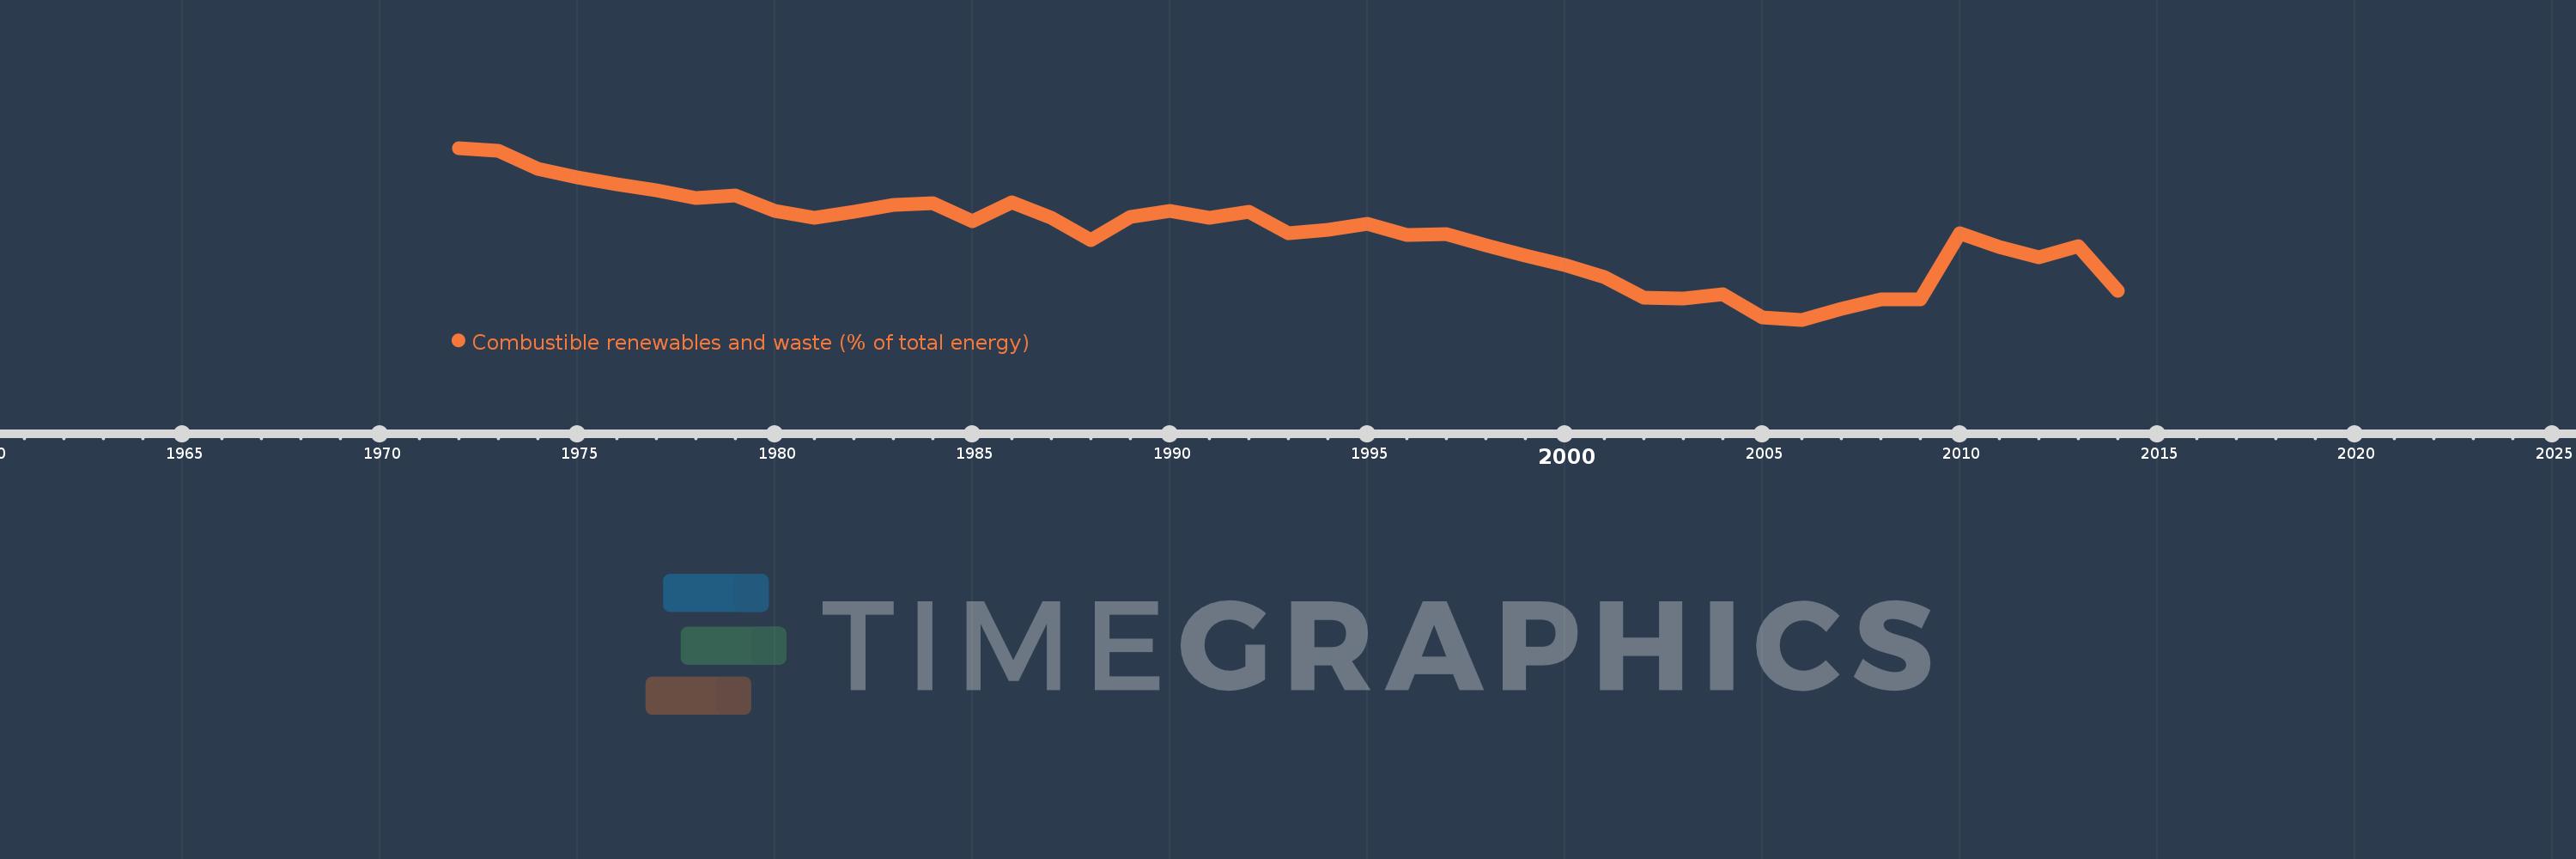
Combustible renewables and waste (% of total energy)
2014,2013,2012,2011,2010,2009,2008,2007,2006,2005,2004,2003,2002,2001,2000,1999,1998,1997,1996,1995,1994,1993,1992,1991,1990,1989,1988,1987,1986,1985,1984,1983,1982,1981,1980,1979,1978,1977,1976,1975,1974,1973,1972
Cette statistique dans les autres pays:
AlbaniaAlgeriaAngolaArab WorldArgentinaArmeniaAustraliaAustriaAzerbaijanBahrainBangladeshBelarusBelgiumBeninBoliviaBosnia and HerzegovinaBotswanaBrazilBrunei DarussalamBulgariaCambodiaCameroonCanadaCaribbean small statesCentral Europe and the BalticsChileChinaColombiaCongo, Dem. Rep.Congo, Rep.Costa RicaCote d'IvoireCroatiaCubaCuracaoCyprusCzech RepublicDenmarkDominican RepublicEarly-demographic dividendEast Asia & PacificEast Asia & Pacific (excluding high income)East Asia & Pacific (IDA & IBRD countries)EcuadorEgypt, Arab Rep.El SalvadorEritreaEstoniaEthiopiaEuro areaEurope & Central AsiaEurope & Central Asia (excluding high income)Europe & Central Asia (IDA & IBRD countries)European UnionFinlandFragile and conflict affected situationsFranceGabonGeorgiaGermanyGhanaGibraltarGreeceGuatemalaHaitiHeavily indebted poor countries (HIPC)High incomeHondurasHong Kong SAR, ChinaHungaryIBRD onlyIcelandIDA & IBRD totalIDA blendIDA onlyIDA totalIndiaIndonesiaIran, Islamic Rep.IraqIrelandIsraelItalyJamaicaJapanJordanKazakhstanKenyaKorea, Dem. People’s Rep.Korea, Rep.KosovoKuwaitKyrgyz RepublicLate-demographic dividendLatin America & Caribbean Latin America & Caribbean (excluding high income)Latin America & the Caribbean (IDA & IBRD countries)LatviaLeast developed countries: UN classificationLebanonLibyaLithuaniaLow & middle incomeLow incomeLower middle incomeLuxembourgMacedonia, FYRMalaysiaMaltaMauritiusMexicoMiddle East & North AfricaMiddle East & North Africa (excluding high income)Middle East & North Africa (IDA & IBRD countries)Middle incomeMoldovaMongoliaMontenegroMoroccoMozambiqueMyanmarNamibiaNepalNetherlandsNew ZealandNicaraguaNigerNigeriaNorth AmericaNorwayOECD membersOmanOther small statesPakistanPanamaParaguayPeruPhilippinesPolandPortugalPost-demographic dividendPre-demographic dividendQatarRomaniaRussian FederationSaudi ArabiaSenegalSerbiaSingaporeSlovak RepublicSloveniaSmall statesSouth AfricaSouth AsiaSouth Asia (IDA & IBRD)South SudanSpainSri LankaSub-Saharan Africa Sub-Saharan Africa (excluding high income)Sub-Saharan Africa (IDA & IBRD countries)SudanSwedenSwitzerlandSyrian Arab RepublicTajikistanTanzaniaThailandTogoTrinidad and TobagoTunisiaTurkeyTurkmenistanUkraineUnited Arab EmiratesUnited KingdomUnited StatesUpper middle incomeUruguayUzbekistanVenezuela, RBVietnamWorldYemen, Rep.ZambiaZimbabwe La ligne de temps
Cette échelle de temps montre un graphique de 1972 année à 2014 année Senegal. Les données jusqu'à 1971 année ne sont pas présentés. Quantité d'observations actuelles selon dates: 43.
Source (désignation):
Les indicateurs du développement mondiale
Source (organisation):
IEA Statistics © OECD/IEA 2014 (http://www.iea.org/stats/index.asp), subject to https://www.iea.org/t&c/termsandconditions/
Catégories:
Energy & Mining
Dernière mise à jour
23 avr. 2017
Les indicateurs de changement de valeurs selon les années
Minimum:
42.685
1 janv. 2006
Maximum:
66.438
1 janv. 1972
Pour la date d''observation
Valeur
Changement absolu
Le changement par rapport à la valeur précédente
1 janv. 1972
66.438
+66.438
0.0%
1 janv. 1973
66.039
-0.399
-0.6%
1 janv. 1974
63.595
-2.444
-3.7%
1 janv. 1975
62.403
-1.192
-1.87%
1 janv. 1976
61.434
-0.969
-1.55%
1 janv. 1977
60.582
-0.852
-1.39%
1 janv. 1978
59.533
-1.049
-1.73%
1 janv. 1979
59.845
+0.312
0.52%
1 janv. 1980
57.675
-2.17
-3.63%
1 janv. 1981
56.741
-0.933
-1.62%
1 janv. 1982
57.565
+0.824
1.45%
1 janv. 1983
58.537
+0.972
1.69%
1 janv. 1984
58.835
+0.298
0.51%
1 janv. 1985
56.324
-2.511
-4.27%
1 janv. 1986
58.893
+2.569
4.56%
1 janv. 1987
56.728
-2.165
-3.68%
1 janv. 1988
53.654
-3.074
-5.42%
1 janv. 1989
56.879
+3.225
6.01%
1 janv. 1990
57.701
+0.822
1.44%
1 janv. 1991
56.743
-0.957
-1.66%
1 janv. 1992
57.613
+0.87
1.53%
1 janv. 1993
54.595
-3.019
-5.24%
1 janv. 1994
55.161
+0.566
1.04%
1 janv. 1995
55.97
+0.809
1.47%
1 janv. 1996
54.351
-1.619
-2.89%
1 janv. 1997
54.576
+0.225
0.41%
1 janv. 1998
52.932
-1.645
-3.01%
1 janv. 1999
51.551
-1.38
-2.61%
1 janv. 2000
50.286
-1.265
-2.45%
1 janv. 2001
48.529
-1.757
-3.49%
1 janv. 2002
45.742
-2.787
-5.74%
1 janv. 2003
45.601
-0.14
-0.31%
1 janv. 2004
46.206
+0.605
1.33%
1 janv. 2005
42.974
-3.232
-6.99%
1 janv. 2006
42.685
-0.289
-0.67%
1 janv. 2007
44.244
+1.559
3.65%
1 janv. 2008
45.49
+1.246
2.82%
1 janv. 2009
45.513
+0.023
0.05%
1 janv. 2010
54.597
+9.083
19.96%
1 janv. 2011
52.74
-1.857
-3.4%
1 janv. 2012
51.29
-1.449
-2.75%
1 janv. 2013
52.828
+1.538
3.0%
1 janv. 2014
46.655
-6.173
-11.68%
Classement des pays selon les statistiques actuelles par années


Commentaires: