29
/fr/
fr
AIzaSyAYiBZKx7MnpbEhh9jyipgxe19OcubqV5w
April 1, 2024
151406
Hong Kong SAR, China
HKG
true
2
1
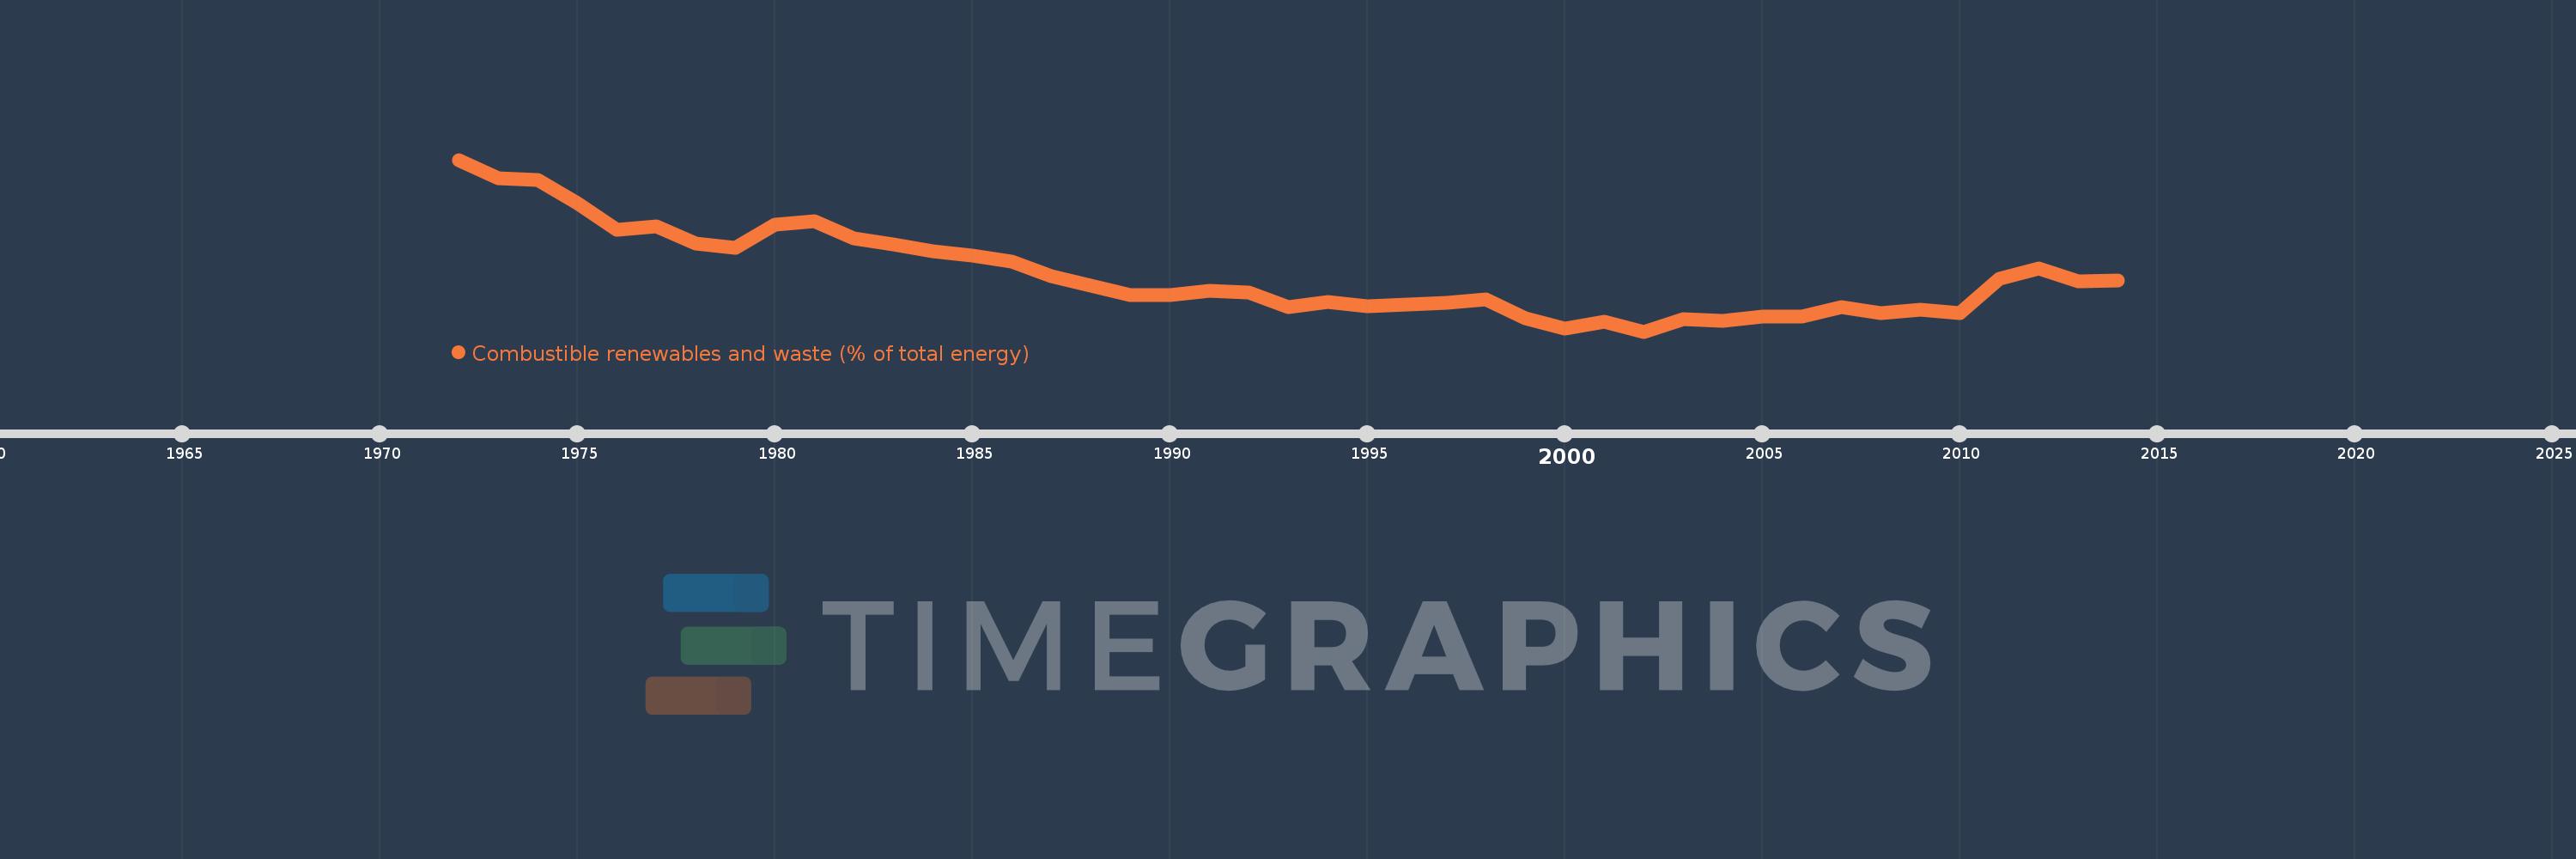
Combustible renewables and waste (% of total energy)
2014,2013,2012,2011,2010,2009,2008,2007,2006,2005,2004,2003,2002,2001,2000,1999,1998,1997,1996,1995,1994,1993,1992,1991,1990,1989,1988,1987,1986,1985,1984,1983,1982,1981,1980,1979,1978,1977,1976,1975,1974,1973,1972
Cette statistique dans les autres pays:
AlbaniaAlgeriaAngolaArab WorldArgentinaArmeniaAustraliaAustriaAzerbaijanBahrainBangladeshBelarusBelgiumBeninBoliviaBosnia and HerzegovinaBotswanaBrazilBrunei DarussalamBulgariaCambodiaCameroonCanadaCaribbean small statesCentral Europe and the BalticsChileChinaColombiaCongo, Dem. Rep.Congo, Rep.Costa RicaCote d'IvoireCroatiaCubaCuracaoCyprusCzech RepublicDenmarkDominican RepublicEarly-demographic dividendEast Asia & PacificEast Asia & Pacific (excluding high income)East Asia & Pacific (IDA & IBRD countries)EcuadorEgypt, Arab Rep.El SalvadorEritreaEstoniaEthiopiaEuro areaEurope & Central AsiaEurope & Central Asia (excluding high income)Europe & Central Asia (IDA & IBRD countries)European UnionFinlandFragile and conflict affected situationsFranceGabonGeorgiaGermanyGhanaGibraltarGreeceGuatemalaHaitiHeavily indebted poor countries (HIPC)High incomeHondurasHong Kong SAR, ChinaHungaryIBRD onlyIcelandIDA & IBRD totalIDA blendIDA onlyIDA totalIndiaIndonesiaIran, Islamic Rep.IraqIrelandIsraelItalyJamaicaJapanJordanKazakhstanKenyaKorea, Dem. People’s Rep.Korea, Rep.KosovoKuwaitKyrgyz RepublicLate-demographic dividendLatin America & Caribbean Latin America & Caribbean (excluding high income)Latin America & the Caribbean (IDA & IBRD countries)LatviaLeast developed countries: UN classificationLebanonLibyaLithuaniaLow & middle incomeLow incomeLower middle incomeLuxembourgMacedonia, FYRMalaysiaMaltaMauritiusMexicoMiddle East & North AfricaMiddle East & North Africa (excluding high income)Middle East & North Africa (IDA & IBRD countries)Middle incomeMoldovaMongoliaMontenegroMoroccoMozambiqueMyanmarNamibiaNepalNetherlandsNew ZealandNicaraguaNigerNigeriaNorth AmericaNorwayOECD membersOmanOther small statesPakistanPanamaParaguayPeruPhilippinesPolandPortugalPost-demographic dividendPre-demographic dividendQatarRomaniaRussian FederationSaudi ArabiaSenegalSerbiaSingaporeSlovak RepublicSloveniaSmall statesSouth AfricaSouth AsiaSouth Asia (IDA & IBRD)South SudanSpainSri LankaSub-Saharan Africa Sub-Saharan Africa (excluding high income)Sub-Saharan Africa (IDA & IBRD countries)SudanSwedenSwitzerlandSyrian Arab RepublicTajikistanTanzaniaThailandTogoTrinidad and TobagoTunisiaTurkeyTurkmenistanUkraineUnited Arab EmiratesUnited KingdomUnited StatesUpper middle incomeUruguayUzbekistanVenezuela, RBVietnamWorldYemen, Rep.ZambiaZimbabwe La ligne de temps
Cette échelle de temps montre un graphique de 1972 année à 2014 année Hong Kong SAR, China. Les données jusqu'à 1971 année ne sont pas présentés. Quantité d'observations actuelles selon dates: 43.
Source (désignation):
Les indicateurs du développement mondiale
Source (organisation):
IEA Statistics © OECD/IEA 2014 (http://www.iea.org/stats/index.asp), subject to https://www.iea.org/t&c/termsandconditions/
Catégories:
Energy & Mining
Dernière mise à jour
23 avr. 2017
Les indicateurs de changement de valeurs selon les années
Minimum:
0.325
1 janv. 2002
Maximum:
1.618
1 janv. 1972
Pour la date d''observation
Valeur
Changement absolu
Le changement par rapport à la valeur précédente
1 janv. 1972
1.618
+1.618
0.0%
1 janv. 1973
1.476
-0.142
-8.77%
1 janv. 1974
1.468
-0.009
-0.58%
1 janv. 1975
1.291
-0.176
-12.01%
1 janv. 1976
1.094
-0.198
-15.3%
1 janv. 1977
1.116
+0.022
1.98%
1 janv. 1978
0.987
-0.129
-11.55%
1 janv. 1979
0.957
-0.029
-2.98%
1 janv. 1980
1.133
+0.176
18.36%
1 janv. 1981
1.154
+0.021
1.87%
1 janv. 1982
1.026
-0.128
-11.11%
1 janv. 1983
0.979
-0.047
-4.59%
1 janv. 1984
0.929
-0.05
-5.11%
1 janv. 1985
0.895
-0.034
-3.69%
1 janv. 1986
0.851
-0.044
-4.88%
1 janv. 1987
0.74
-0.111
-13.08%
1 janv. 1988
0.674
-0.066
-8.89%
1 janv. 1989
0.598
-0.076
-11.3%
1 janv. 1990
0.602
+0.004
0.7%
1 janv. 1991
0.629
+0.027
4.55%
1 janv. 1992
0.621
-0.008
-1.32%
1 janv. 1993
0.512
-0.109
-17.53%
1 janv. 1994
0.546
+0.033
6.51%
1 janv. 1995
0.516
-0.03
-5.49%
1 janv. 1996
0.528
+0.012
2.42%
1 janv. 1997
0.543
+0.015
2.85%
1 janv. 1998
0.57
+0.027
4.96%
1 janv. 1999
0.427
-0.143
-25.15%
1 janv. 2000
0.349
-0.078
-18.19%
1 janv. 2001
0.4
+0.051
14.53%
1 janv. 2002
0.325
-0.075
-18.76%
1 janv. 2003
0.421
+0.096
29.52%
1 janv. 2004
0.409
-0.012
-2.74%
1 janv. 2005
0.435
+0.026
6.26%
1 janv. 2006
0.436
+0.001
0.33%
1 janv. 2007
0.511
+0.075
17.22%
1 janv. 2008
0.463
-0.048
-9.46%
1 janv. 2009
0.493
+0.03
6.47%
1 janv. 2010
0.461
-0.032
-6.54%
1 janv. 2011
0.721
+0.26
56.47%
1 janv. 2012
0.802
+0.081
11.28%
1 janv. 2013
0.704
-0.098
-12.21%
1 janv. 2014
0.707
+0.003
0.47%
Classement des pays selon les statistiques actuelles par années


Commentaires: