29
/fr/
fr
AIzaSyAYiBZKx7MnpbEhh9jyipgxe19OcubqV5w
April 1, 2024
232433
Samoa
WSM
true
2
1
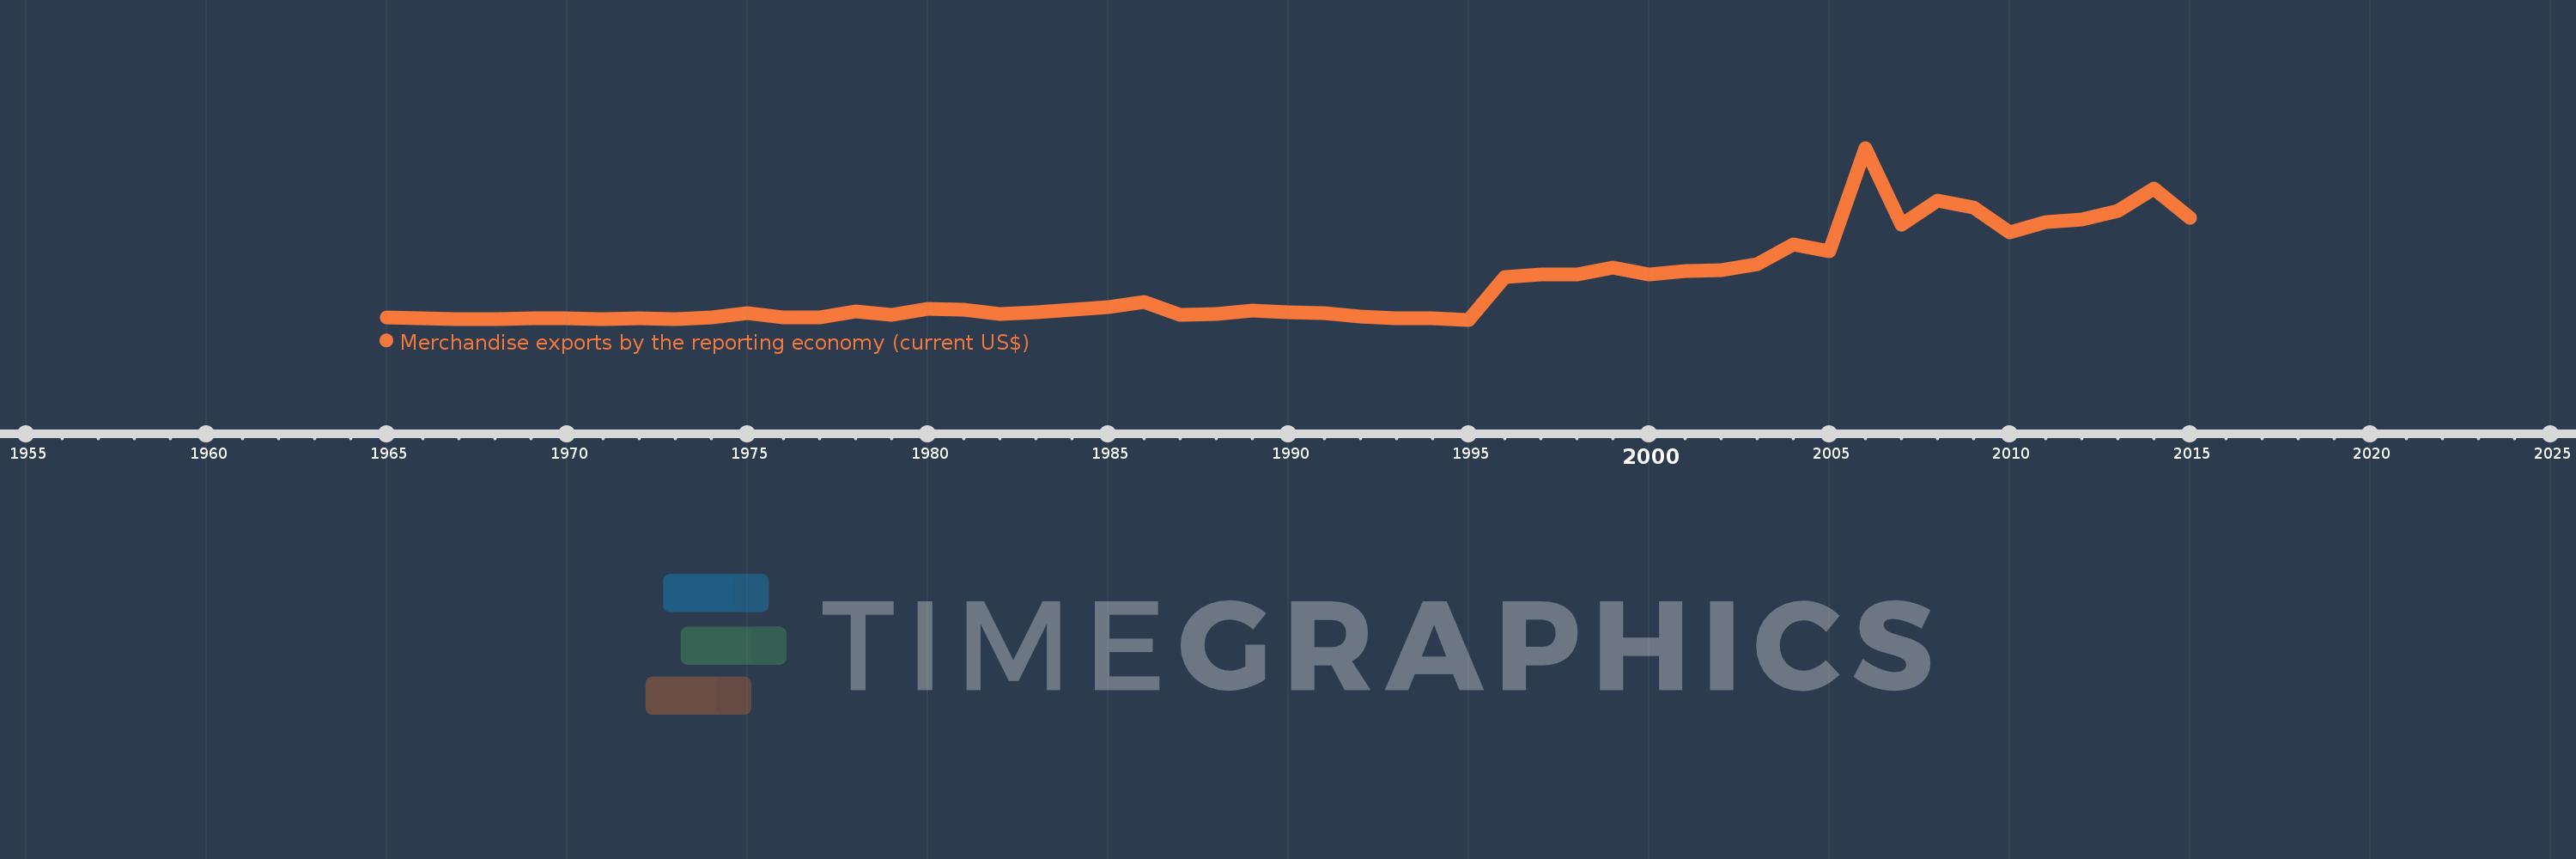
Merchandise exports by the reporting economy (current US$)
2015,2014,2013,2012,2011,2010,2009,2008,2007,2006,2005,2004,2003,2002,2001,2000,1999,1998,1997,1996,1995,1994,1993,1992,1991,1990,1989,1988,1987,1986,1985,1984,1983,1982,1981,1980,1979,1978,1977,1976,1975,1974,1973,1972,1971,1970,1969,1968,1967,1966,1965
Cette statistique dans les autres pays:
AfghanistanAlbaniaAlgeriaAmerican SamoaAngolaAntigua and BarbudaArab WorldArgentinaArmeniaArubaAustraliaAustriaAzerbaijanBahamas, TheBahrainBangladeshBarbadosBelarusBelgiumBelizeBeninBermudaBoliviaBosnia and HerzegovinaBrazilBrunei DarussalamBulgariaBurkina FasoBurundiCabo VerdeCambodiaCameroonCanadaCaribbean small statesCentral African RepublicCentral Europe and the BalticsChadChileChinaColombiaComorosCongo, Dem. Rep.Congo, Rep.Costa RicaCote d'IvoireCroatiaCubaCyprusCzech RepublicDenmarkDjiboutiDominicaDominican RepublicEarly-demographic dividendEast Asia & PacificEast Asia & Pacific (excluding high income)East Asia & Pacific (IDA & IBRD countries)EcuadorEgypt, Arab Rep.El SalvadorEquatorial GuineaEstoniaEthiopiaEuro areaEurope & Central AsiaEurope & Central Asia (excluding high income)Europe & Central Asia (IDA & IBRD countries)European UnionFaroe IslandsFijiFinlandFragile and conflict affected situationsFranceFrench PolynesiaGabonGambia, TheGeorgiaGermanyGhanaGibraltarGreeceGreenlandGrenadaGuamGuatemalaGuineaGuinea-BissauGuyanaHaitiHeavily indebted poor countries (HIPC)High incomeHondurasHong Kong SAR, ChinaHungaryIBRD onlyIcelandIDA & IBRD totalIDA blendIDA onlyIDA totalIndiaIndonesiaIran, Islamic Rep.IraqIrelandIsraelItalyJamaicaJapanJordanKazakhstanKenyaKiribatiKorea, Dem. People’s Rep.Korea, Rep.KosovoKuwaitKyrgyz RepublicLao PDRLate-demographic dividendLatin America & Caribbean Latin America & Caribbean (excluding high income)Latin America & the Caribbean (IDA & IBRD countries)LatviaLeast developed countries: UN classificationLebanonLiberiaLibyaLithuaniaLow & middle incomeLow incomeLower middle incomeLuxembourgMacao SAR, ChinaMacedonia, FYRMadagascarMalawiMalaysiaMaldivesMaliMaltaMauritaniaMauritiusMexicoMiddle East & North AfricaMiddle East & North Africa (excluding high income)Middle East & North Africa (IDA & IBRD countries)Middle incomeMoldovaMongoliaMontenegroMoroccoMozambiqueMyanmarNauruNepalNetherlandsNew CaledoniaNew ZealandNicaraguaNigerNigeriaNorth AmericaNorwayOECD membersOmanOther small statesPacific island small statesPakistanPanamaPapua New GuineaParaguayPeruPhilippinesPolandPortugalPost-demographic dividendPre-demographic dividendQatarRomaniaRussian FederationRwandaSamoaSao Tome and PrincipeSaudi ArabiaSenegalSerbiaSeychellesSierra LeoneSingaporeSlovak RepublicSloveniaSmall statesSolomon IslandsSomaliaSouth AfricaSouth AsiaSouth Asia (IDA & IBRD)SpainSri LankaSt. Kitts and NevisSt. LuciaSt. Vincent and the GrenadinesSub-Saharan Africa Sub-Saharan Africa (excluding high income)Sub-Saharan Africa (IDA & IBRD countries)SudanSurinameSwedenSwitzerlandSyrian Arab RepublicTajikistanTanzaniaThailandTogoTongaTrinidad and TobagoTunisiaTurkeyTurkmenistanTuvaluUgandaUkraineUnited Arab EmiratesUnited KingdomUnited StatesUpper middle incomeUruguayUzbekistanVanuatuVenezuela, RBVietnamWorldYemen, Rep.ZambiaZimbabwe La ligne de temps
Cette échelle de temps montre un graphique de 1965 année à 2015 année Samoa. Les données jusqu'à 1964 année ne sont pas présentés. Quantité d'observations actuelles selon dates: 51.
Source (désignation):
Les indicateurs du développement mondiale
Source (organisation):
World Bank staff estimates based data from International Monetary Fund's Direction of Trade database.
Catégories:
Private Sector, Trade
Dernière mise à jour
23 avr. 2017
Les indicateurs de changement de valeurs selon les années
Minimum:
3.977 mln.
1 janv. 1995
Maximum:
233.074 mln.
1 janv. 2006
Pour la date d''observation
Valeur
Changement absolu
Le changement par rapport à la valeur précédente
1 janv. 1965
6.8 mln.
+6.8 mln.
0.0%
1 janv. 1966
5.5 mln.
-1.3 mln.
-19.12%
1 janv. 1967
4.6 mln.
-900.0 milles
-16.36%
1 janv. 1968
4.4 mln.
-200.0 milles
-4.35%
1 janv. 1969
5.4 mln.
+1000.0 milles
22.73%
1 janv. 1970
6.444 mln.
+1.044 mln.
19.33%
1 janv. 1971
4.5 mln.
-1.944 mln.
-30.17%
1 janv. 1972
6.3 mln.
+1.8 mln.
40.0%
1 janv. 1973
5.1 mln.
-1.2 mln.
-19.05%
1 janv. 1974
6.545 mln.
+1.445 mln.
28.33%
1 janv. 1975
12.709 mln.
+6.164 mln.
94.18%
1 janv. 1976
7.208 mln.
-5.501 mln.
-43.28%
1 janv. 1977
6.859 mln.
-349.0 milles
-4.84%
1 janv. 1978
15.254 mln.
+8.395 mln.
122.39%
1 janv. 1979
10.134 mln.
-5.12 mln.
-33.56%
1 janv. 1980
18.762 mln.
+8.628 mln.
85.14%
1 janv. 1981
17.809 mln.
-953.0 milles
-5.08%
1 janv. 1982
12.195 mln.
-5.614 mln.
-31.52%
1 janv. 1983
14.308 mln.
+2.113 mln.
17.33%
1 janv. 1984
17.392 mln.
+3.084 mln.
21.55%
1 janv. 1985
21.029 mln.
+3.637 mln.
20.91%
1 janv. 1986
27.263 mln.
+6.234 mln.
29.64%
1 janv. 1987
10.487 mln.
-16.776 mln.
-61.53%
1 janv. 1988
11.079 mln.
+592.0 milles
5.65%
1 janv. 1989
15.852 mln.
+4.773 mln.
43.08%
1 janv. 1990
13.685 mln.
-2.167 mln.
-13.67%
1 janv. 1991
12.462 mln.
-1.223 mln.
-8.94%
1 janv. 1992
8.16 mln.
-4.301 mln.
-34.52%
1 janv. 1993
5.803 mln.
-2.357 mln.
-28.88%
1 janv. 1994
6.435 mln.
+631.543 milles
10.88%
1 janv. 1995
3.977 mln.
-2.458 mln.
-38.2%
1 janv. 1996
60.9 mln.
+56.923 mln.
1.43 milles%
1 janv. 1997
64.754 mln.
+3.854 mln.
6.33%
1 janv. 1998
64.685 mln.
-68.864 milles
-0.11%
1 janv. 1999
73.973 mln.
+9.288 mln.
14.36%
1 janv. 2000
64.792 mln.
-9.181 mln.
-12.41%
1 janv. 2001
68.722 mln.
+3.93 mln.
6.07%
1 janv. 2002
70.087 mln.
+1.365 mln.
1.99%
1 janv. 2003
77.712 mln.
+7.625 mln.
10.88%
1 janv. 2004
104.729 mln.
+27.017 mln.
34.77%
1 janv. 2005
95.841 mln.
-8.888 mln.
-8.49%
1 janv. 2006
233.074 mln.
+137.233 mln.
143.19%
1 janv. 2007
131.32 mln.
-101.754 mln.
-43.66%
1 janv. 2008
162.77 mln.
+31.45 mln.
23.95%
1 janv. 2009
153.254 mln.
-9.516 mln.
-5.85%
1 janv. 2010
120.32 mln.
-32.934 mln.
-21.49%
1 janv. 2011
134.038 mln.
+13.718 mln.
11.4%
1 janv. 2012
137.842 mln.
+3.805 mln.
2.84%
1 janv. 2013
149.446 mln.
+11.604 mln.
8.42%
1 janv. 2014
178.394 mln.
+28.948 mln.
19.37%
1 janv. 2015
140.16 mln.
-38.234 mln.
-21.43%
Classement des pays selon les statistiques actuelles par années


Commentaires: