29
/fr/
fr
AIzaSyAYiBZKx7MnpbEhh9jyipgxe19OcubqV5w
April 1, 2024
111199
Congo, Rep.
COG
true
2
1
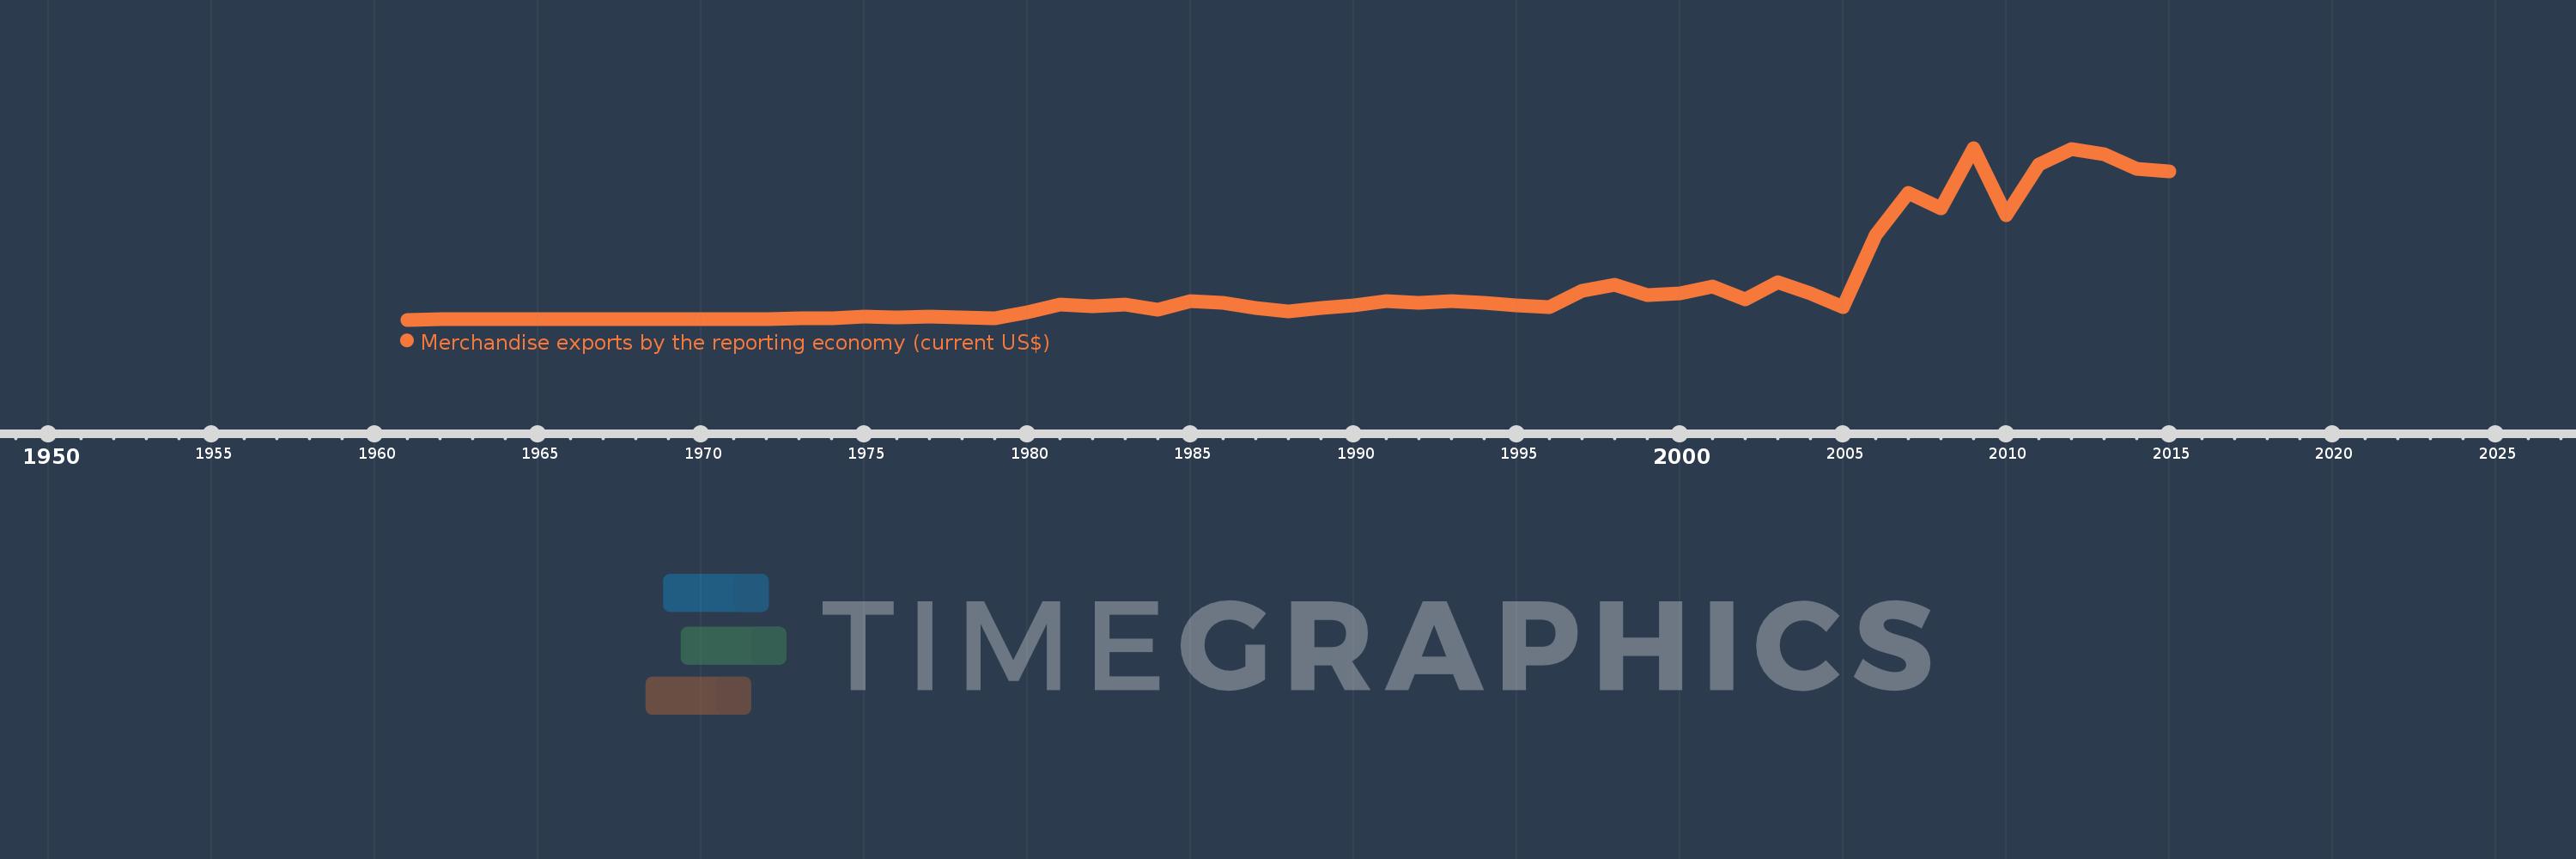
Merchandise exports by the reporting economy (current US$)
2015,2014,2013,2012,2011,2010,2009,2008,2007,2006,2005,2004,2003,2002,2001,2000,1999,1998,1997,1996,1995,1994,1993,1992,1991,1990,1989,1988,1987,1986,1985,1984,1983,1982,1981,1980,1979,1978,1977,1976,1975,1974,1973,1972,1971,1970,1969,1968,1967,1966,1965,1964,1963,1962,1961
Cette statistique dans les autres pays:
AfghanistanAlbaniaAlgeriaAmerican SamoaAngolaAntigua and BarbudaArab WorldArgentinaArmeniaArubaAustraliaAustriaAzerbaijanBahamas, TheBahrainBangladeshBarbadosBelarusBelgiumBelizeBeninBermudaBoliviaBosnia and HerzegovinaBrazilBrunei DarussalamBulgariaBurkina FasoBurundiCabo VerdeCambodiaCameroonCanadaCaribbean small statesCentral African RepublicCentral Europe and the BalticsChadChileChinaColombiaComorosCongo, Dem. Rep.Congo, Rep.Costa RicaCote d'IvoireCroatiaCubaCyprusCzech RepublicDenmarkDjiboutiDominicaDominican RepublicEarly-demographic dividendEast Asia & PacificEast Asia & Pacific (excluding high income)East Asia & Pacific (IDA & IBRD countries)EcuadorEgypt, Arab Rep.El SalvadorEquatorial GuineaEstoniaEthiopiaEuro areaEurope & Central AsiaEurope & Central Asia (excluding high income)Europe & Central Asia (IDA & IBRD countries)European UnionFaroe IslandsFijiFinlandFragile and conflict affected situationsFranceFrench PolynesiaGabonGambia, TheGeorgiaGermanyGhanaGibraltarGreeceGreenlandGrenadaGuamGuatemalaGuineaGuinea-BissauGuyanaHaitiHeavily indebted poor countries (HIPC)High incomeHondurasHong Kong SAR, ChinaHungaryIBRD onlyIcelandIDA & IBRD totalIDA blendIDA onlyIDA totalIndiaIndonesiaIran, Islamic Rep.IraqIrelandIsraelItalyJamaicaJapanJordanKazakhstanKenyaKiribatiKorea, Dem. People’s Rep.Korea, Rep.KosovoKuwaitKyrgyz RepublicLao PDRLate-demographic dividendLatin America & Caribbean Latin America & Caribbean (excluding high income)Latin America & the Caribbean (IDA & IBRD countries)LatviaLeast developed countries: UN classificationLebanonLiberiaLibyaLithuaniaLow & middle incomeLow incomeLower middle incomeLuxembourgMacao SAR, ChinaMacedonia, FYRMadagascarMalawiMalaysiaMaldivesMaliMaltaMauritaniaMauritiusMexicoMiddle East & North AfricaMiddle East & North Africa (excluding high income)Middle East & North Africa (IDA & IBRD countries)Middle incomeMoldovaMongoliaMontenegroMoroccoMozambiqueMyanmarNauruNepalNetherlandsNew CaledoniaNew ZealandNicaraguaNigerNigeriaNorth AmericaNorwayOECD membersOmanOther small statesPacific island small statesPakistanPanamaPapua New GuineaParaguayPeruPhilippinesPolandPortugalPost-demographic dividendPre-demographic dividendQatarRomaniaRussian FederationRwandaSamoaSao Tome and PrincipeSaudi ArabiaSenegalSerbiaSeychellesSierra LeoneSingaporeSlovak RepublicSloveniaSmall statesSolomon IslandsSomaliaSouth AfricaSouth AsiaSouth Asia (IDA & IBRD)SpainSri LankaSt. Kitts and NevisSt. LuciaSt. Vincent and the GrenadinesSub-Saharan Africa Sub-Saharan Africa (excluding high income)Sub-Saharan Africa (IDA & IBRD countries)SudanSurinameSwedenSwitzerlandSyrian Arab RepublicTajikistanTanzaniaThailandTogoTongaTrinidad and TobagoTunisiaTurkeyTurkmenistanTuvaluUgandaUkraineUnited Arab EmiratesUnited KingdomUnited StatesUpper middle incomeUruguayUzbekistanVanuatuVenezuela, RBVietnamWorldYemen, Rep.ZambiaZimbabwe La ligne de temps
Cette échelle de temps montre un graphique de 1961 année à 2015 année Congo, Rep.. Les données jusqu'à 1960 année ne sont pas présentés. Quantité d'observations actuelles selon dates: 55.
Source (désignation):
Les indicateurs du développement mondiale
Source (organisation):
World Bank staff estimates based data from International Monetary Fund's Direction of Trade database.
Catégories:
Private Sector, Trade
Dernière mise à jour
23 avr. 2017
Les indicateurs de changement de valeurs selon les années
Minimum:
1.9 mln.
1 janv. 1961
Maximum:
11.057 mds
1 janv. 2009
Pour la date d''observation
Valeur
Changement absolu
Le changement par rapport à la valeur précédente
1 janv. 1961
1.9 mln.
+1.9 mln.
0.0%
1 janv. 1962
19.4 mln.
+17.5 mln.
921.05%
1 janv. 1963
35.2 mln.
+15.8 mln.
81.44%
1 janv. 1964
41.5 mln.
+6.3 mln.
17.9%
1 janv. 1965
47.3 mln.
+5.8 mln.
13.98%
1 janv. 1966
46.6 mln.
-700.0 milles
-1.48%
1 janv. 1967
43.0 mln.
-3.6 mln.
-7.73%
1 janv. 1968
47.8 mln.
+4.8 mln.
11.16%
1 janv. 1969
51.65 mln.
+3.85 mln.
8.05%
1 janv. 1970
46.415 mln.
-5.235 mln.
-10.14%
1 janv. 1971
30.66 mln.
-15.755 mln.
-33.94%
1 janv. 1972
39.316 mln.
+8.656 mln.
28.23%
1 janv. 1973
74.327 mln.
+35.011 mln.
89.05%
1 janv. 1974
84.834 mln.
+10.507 mln.
14.14%
1 janv. 1975
227.519 mln.
+142.685 mln.
168.19%
1 janv. 1976
178.42 mln.
-49.099 mln.
-21.58%
1 janv. 1977
181.418 mln.
+2.998 mln.
1.68%
1 janv. 1978
171.972 mln.
-9.446 mln.
-5.21%
1 janv. 1979
117.085 mln.
-54.887 mln.
-31.92%
1 janv. 1980
508.593 mln.
+391.508 mln.
334.38%
1 janv. 1981
958.79 mln.
+450.197 mln.
88.52%
1 janv. 1982
894.651 mln.
-64.139 mln.
-6.69%
1 janv. 1983
1.004 mds
+109.798 mln.
12.27%
1 janv. 1984
639.053 mln.
-365.396 mln.
-36.38%
1 janv. 1985
1.181 mds
+541.509 mln.
84.74%
1 janv. 1986
1.086 mds
-94.542 mln.
-8.01%
1 janv. 1987
772.873 mln.
-313.148 mln.
-28.83%
1 janv. 1988
512.289 mln.
-260.583 mln.
-33.72%
1 janv. 1989
746.219 mln.
+233.93 mln.
45.66%
1 janv. 1990
906.548 mln.
+160.329 mln.
21.49%
1 janv. 1991
1.205 mds
+298.21 mln.
32.9%
1 janv. 1992
1.107 mds
-97.638 mln.
-8.1%
1 janv. 1993
1.184 mds
+77.152 mln.
6.97%
1 janv. 1994
1.096 mds
-88.544 mln.
-7.48%
1 janv. 1995
929.281 mln.
-166.447 mln.
-15.19%
1 janv. 1996
838.625 mln.
-90.656 mln.
-9.76%
1 janv. 1997
1.848 mds
+1.009 mds
120.37%
1 janv. 1998
2.259 mds
+410.743 mln.
22.23%
1 janv. 1999
1.567 mds
-691.846 mln.
-30.63%
1 janv. 2000
1.716 mds
+149.356 mln.
9.53%
1 janv. 2001
2.154 mds
+437.584 mln.
25.5%
1 janv. 2002
1.312 mds
-841.827 mln.
-39.08%
1 janv. 2003
2.396 mds
+1.084 mds
82.63%
1 janv. 2004
1.71 mds
-686.42 mln.
-28.65%
1 janv. 2005
838.722 mln.
-871.0 mln.
-50.94%
1 janv. 2006
5.43 mds
+4.592 mds
547.46%
1 janv. 2007
8.186 mds
+2.756 mds
50.75%
1 janv. 2008
7.18 mds
-1.007 mds
-12.3%
1 janv. 2009
11.057 mds
+3.877 mds
54.0%
1 janv. 2010
6.74 mds
-4.317 mds
-39.04%
1 janv. 2011
10.002 mds
+3.262 mds
48.4%
1 janv. 2012
11.004 mds
+1.001 mds
10.01%
1 janv. 2013
10.642 mds
-361.67 mln.
-3.29%
1 janv. 2014
9.703 mds
-938.825 mln.
-8.82%
1 janv. 2015
9.576 mds
-127.645 mln.
-1.32%
Classement des pays selon les statistiques actuelles par années


Commentaires: