29
/fr/
fr
AIzaSyAYiBZKx7MnpbEhh9jyipgxe19OcubqV5w
April 1, 2024
142061
Greece
GRC
true
2
1
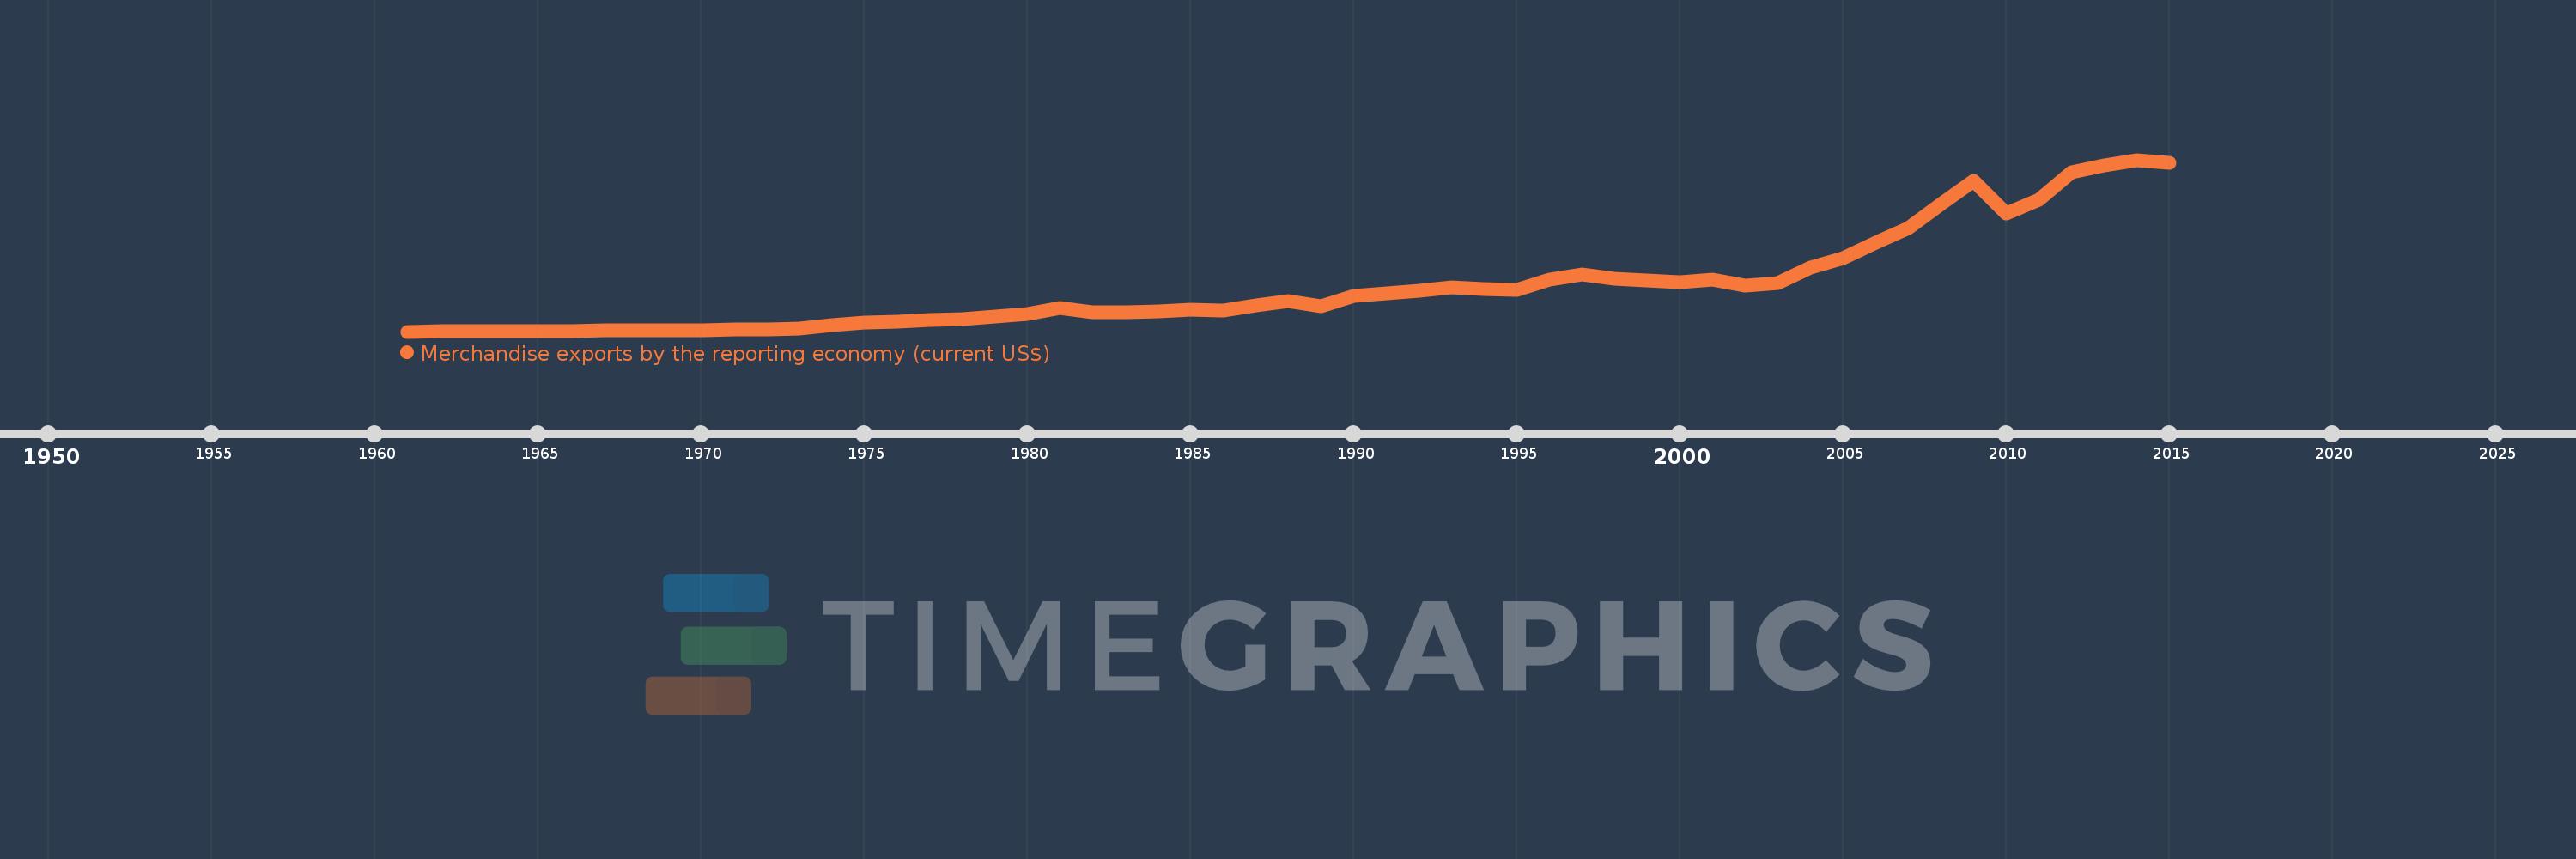
Merchandise exports by the reporting economy (current US$)
2015,2014,2013,2012,2011,2010,2009,2008,2007,2006,2005,2004,2003,2002,2001,2000,1999,1998,1997,1996,1995,1994,1993,1992,1991,1990,1989,1988,1987,1986,1985,1984,1983,1982,1981,1980,1979,1978,1977,1976,1975,1974,1973,1972,1971,1970,1969,1968,1967,1966,1965,1964,1963,1962,1961
Cette statistique dans les autres pays:
AfghanistanAlbaniaAlgeriaAmerican SamoaAngolaAntigua and BarbudaArab WorldArgentinaArmeniaArubaAustraliaAustriaAzerbaijanBahamas, TheBahrainBangladeshBarbadosBelarusBelgiumBelizeBeninBermudaBoliviaBosnia and HerzegovinaBrazilBrunei DarussalamBulgariaBurkina FasoBurundiCabo VerdeCambodiaCameroonCanadaCaribbean small statesCentral African RepublicCentral Europe and the BalticsChadChileChinaColombiaComorosCongo, Dem. Rep.Congo, Rep.Costa RicaCote d'IvoireCroatiaCubaCyprusCzech RepublicDenmarkDjiboutiDominicaDominican RepublicEarly-demographic dividendEast Asia & PacificEast Asia & Pacific (excluding high income)East Asia & Pacific (IDA & IBRD countries)EcuadorEgypt, Arab Rep.El SalvadorEquatorial GuineaEstoniaEthiopiaEuro areaEurope & Central AsiaEurope & Central Asia (excluding high income)Europe & Central Asia (IDA & IBRD countries)European UnionFaroe IslandsFijiFinlandFragile and conflict affected situationsFranceFrench PolynesiaGabonGambia, TheGeorgiaGermanyGhanaGibraltarGreeceGreenlandGrenadaGuamGuatemalaGuineaGuinea-BissauGuyanaHaitiHeavily indebted poor countries (HIPC)High incomeHondurasHong Kong SAR, ChinaHungaryIBRD onlyIcelandIDA & IBRD totalIDA blendIDA onlyIDA totalIndiaIndonesiaIran, Islamic Rep.IraqIrelandIsraelItalyJamaicaJapanJordanKazakhstanKenyaKiribatiKorea, Dem. People’s Rep.Korea, Rep.KosovoKuwaitKyrgyz RepublicLao PDRLate-demographic dividendLatin America & Caribbean Latin America & Caribbean (excluding high income)Latin America & the Caribbean (IDA & IBRD countries)LatviaLeast developed countries: UN classificationLebanonLiberiaLibyaLithuaniaLow & middle incomeLow incomeLower middle incomeLuxembourgMacao SAR, ChinaMacedonia, FYRMadagascarMalawiMalaysiaMaldivesMaliMaltaMauritaniaMauritiusMexicoMiddle East & North AfricaMiddle East & North Africa (excluding high income)Middle East & North Africa (IDA & IBRD countries)Middle incomeMoldovaMongoliaMontenegroMoroccoMozambiqueMyanmarNauruNepalNetherlandsNew CaledoniaNew ZealandNicaraguaNigerNigeriaNorth AmericaNorwayOECD membersOmanOther small statesPacific island small statesPakistanPanamaPapua New GuineaParaguayPeruPhilippinesPolandPortugalPost-demographic dividendPre-demographic dividendQatarRomaniaRussian FederationRwandaSamoaSao Tome and PrincipeSaudi ArabiaSenegalSerbiaSeychellesSierra LeoneSingaporeSlovak RepublicSloveniaSmall statesSolomon IslandsSomaliaSouth AfricaSouth AsiaSouth Asia (IDA & IBRD)SpainSri LankaSt. Kitts and NevisSt. LuciaSt. Vincent and the GrenadinesSub-Saharan Africa Sub-Saharan Africa (excluding high income)Sub-Saharan Africa (IDA & IBRD countries)SudanSurinameSwedenSwitzerlandSyrian Arab RepublicTajikistanTanzaniaThailandTogoTongaTrinidad and TobagoTunisiaTurkeyTurkmenistanTuvaluUgandaUkraineUnited Arab EmiratesUnited KingdomUnited StatesUpper middle incomeUruguayUzbekistanVanuatuVenezuela, RBVietnamWorldYemen, Rep.ZambiaZimbabwe La ligne de temps
Cette échelle de temps montre un graphique de 1961 année à 2015 année Greece. Les données jusqu'à 1960 année ne sont pas présentés. Quantité d'observations actuelles selon dates: 55.
Source (désignation):
Les indicateurs du développement mondiale
Source (organisation):
World Bank staff estimates based data from International Monetary Fund's Direction of Trade database.
Catégories:
Private Sector, Trade
Dernière mise à jour
23 avr. 2017
Les indicateurs de changement de valeurs selon les années
Minimum:
203.1 mln.
1 janv. 1961
Maximum:
35.78 mds
1 janv. 2014
Pour la date d''observation
Valeur
Changement absolu
Le changement par rapport à la valeur précédente
1 janv. 1961
203.1 mln.
+203.1 mln.
0.0%
1 janv. 1962
222.5 mln.
+19.4 mln.
9.55%
1 janv. 1963
248.3 mln.
+25.8 mln.
11.6%
1 janv. 1964
290.2 mln.
+41.9 mln.
16.87%
1 janv. 1965
308.7 mln.
+18.5 mln.
6.37%
1 janv. 1966
327.6 mln.
+18.9 mln.
6.12%
1 janv. 1967
406.0 mln.
+78.4 mln.
23.93%
1 janv. 1968
494.8 mln.
+88.8 mln.
21.87%
1 janv. 1969
467.9 mln.
-26.9 mln.
-5.44%
1 janv. 1970
553.85 mln.
+85.95 mln.
18.37%
1 janv. 1971
643.92 mln.
+90.07 mln.
16.26%
1 janv. 1972
662.62 mln.
+18.7 mln.
2.9%
1 janv. 1973
870.62 mln.
+208.0 mln.
31.39%
1 janv. 1974
1.454 mds
+583.37 mln.
67.01%
1 janv. 1975
2.029 mds
+575.48 mln.
39.58%
1 janv. 1976
2.293 mds
+263.33 mln.
12.98%
1 janv. 1977
2.553 mds
+259.96 mln.
11.34%
1 janv. 1978
2.753 mds
+200.46 mln.
7.85%
1 janv. 1979
3.375 mds
+622.09 mln.
22.59%
1 janv. 1980
3.881 mds
+505.9 mln.
14.99%
1 janv. 1981
5.183 mds
+1.302 mds
33.54%
1 janv. 1982
4.246 mds
-937.37 mln.
-18.09%
1 janv. 1983
4.294 mds
+48.4 mln.
1.14%
1 janv. 1984
4.413 mds
+118.99 mln.
2.77%
1 janv. 1985
4.815 mds
+402.21 mln.
9.11%
1 janv. 1986
4.562 mds
-253.3 mln.
-5.26%
1 janv. 1987
5.651 mds
+1.089 mds
23.87%
1 janv. 1988
6.532 mds
+881.43 mln.
15.6%
1 janv. 1989
5.429 mds
-1.104 mds
-16.89%
1 janv. 1990
7.531 mds
+2.103 mds
38.73%
1 janv. 1991
8.063 mds
+531.662 mln.
7.06%
1 janv. 1992
8.67 mds
+607.044 mln.
7.53%
1 janv. 1993
9.437 mds
+767.694 mln.
8.85%
1 janv. 1994
9.093 mds
-344.618 mln.
-3.65%
1 janv. 1995
8.808 mds
-284.586 mln.
-3.13%
1 janv. 1996
10.961 mds
+2.153 mds
24.45%
1 janv. 1997
11.949 mds
+987.526 mln.
9.01%
1 janv. 1998
11.13 mds
-819.175 mln.
-6.86%
1 janv. 1999
10.737 mds
-392.483 mln.
-3.53%
1 janv. 2000
10.481 mds
-256.029 mln.
-2.38%
1 janv. 2001
10.978 mds
+497.029 mln.
4.74%
1 janv. 2002
9.711 mds
-1.268 mds
-11.55%
1 janv. 2003
10.332 mds
+621.793 mln.
6.4%
1 janv. 2004
13.38 mds
+3.048 mds
29.5%
1 janv. 2005
15.337 mds
+1.956 mds
14.62%
1 janv. 2006
18.535 mds
+3.198 mds
20.85%
1 janv. 2007
21.711 mds
+3.176 mds
17.14%
1 janv. 2008
26.66 mds
+4.949 mds
22.79%
1 janv. 2009
31.413 mds
+4.752 mds
17.83%
1 janv. 2010
24.665 mds
-6.747 mds
-21.48%
1 janv. 2011
27.451 mds
+2.786 mds
11.29%
1 janv. 2012
33.204 mds
+5.753 mds
20.96%
1 janv. 2013
34.647 mds
+1.444 mds
4.35%
1 janv. 2014
35.78 mds
+1.133 mds
3.27%
1 janv. 2015
35.182 mds
-598.359 mln.
-1.67%
Classement des pays selon les statistiques actuelles par années


Commentaires: