29
/fr/
fr
AIzaSyAYiBZKx7MnpbEhh9jyipgxe19OcubqV5w
April 1, 2024
211970
Niger
NER
true
2
1
Merchandise exports by the reporting economy (current US$)
2015,2014,2013,2012,2011,2010,2009,2008,2007,2006,2005,2004,2003,2002,2001,2000,1999,1998,1997,1996,1995,1994,1993,1992,1991,1990,1989,1988,1987,1986,1985,1984,1983,1982,1981,1980,1979,1978,1977,1976,1975,1974,1973,1972,1971,1970,1969,1968,1967,1966,1965,1964,1963,1962,1961
Cette statistique dans les autres pays:
AfghanistanAlbaniaAlgeriaAmerican SamoaAngolaAntigua and BarbudaArab WorldArgentinaArmeniaArubaAustraliaAustriaAzerbaijanBahamas, TheBahrainBangladeshBarbadosBelarusBelgiumBelizeBeninBermudaBoliviaBosnia and HerzegovinaBrazilBrunei DarussalamBulgariaBurkina FasoBurundiCabo VerdeCambodiaCameroonCanadaCaribbean small statesCentral African RepublicCentral Europe and the BalticsChadChileChinaColombiaComorosCongo, Dem. Rep.Congo, Rep.Costa RicaCote d'IvoireCroatiaCubaCyprusCzech RepublicDenmarkDjiboutiDominicaDominican RepublicEarly-demographic dividendEast Asia & PacificEast Asia & Pacific (excluding high income)East Asia & Pacific (IDA & IBRD countries)EcuadorEgypt, Arab Rep.El SalvadorEquatorial GuineaEstoniaEthiopiaEuro areaEurope & Central AsiaEurope & Central Asia (excluding high income)Europe & Central Asia (IDA & IBRD countries)European UnionFaroe IslandsFijiFinlandFragile and conflict affected situationsFranceFrench PolynesiaGabonGambia, TheGeorgiaGermanyGhanaGibraltarGreeceGreenlandGrenadaGuamGuatemalaGuineaGuinea-BissauGuyanaHaitiHeavily indebted poor countries (HIPC)High incomeHondurasHong Kong SAR, ChinaHungaryIBRD onlyIcelandIDA & IBRD totalIDA blendIDA onlyIDA totalIndiaIndonesiaIran, Islamic Rep.IraqIrelandIsraelItalyJamaicaJapanJordanKazakhstanKenyaKiribatiKorea, Dem. People’s Rep.Korea, Rep.KosovoKuwaitKyrgyz RepublicLao PDRLate-demographic dividendLatin America & Caribbean Latin America & Caribbean (excluding high income)Latin America & the Caribbean (IDA & IBRD countries)LatviaLeast developed countries: UN classificationLebanonLiberiaLibyaLithuaniaLow & middle incomeLow incomeLower middle incomeLuxembourgMacao SAR, ChinaMacedonia, FYRMadagascarMalawiMalaysiaMaldivesMaliMaltaMauritaniaMauritiusMexicoMiddle East & North AfricaMiddle East & North Africa (excluding high income)Middle East & North Africa (IDA & IBRD countries)Middle incomeMoldovaMongoliaMontenegroMoroccoMozambiqueMyanmarNauruNepalNetherlandsNew CaledoniaNew ZealandNicaraguaNigerNigeriaNorth AmericaNorwayOECD membersOmanOther small statesPacific island small statesPakistanPanamaPapua New GuineaParaguayPeruPhilippinesPolandPortugalPost-demographic dividendPre-demographic dividendQatarRomaniaRussian FederationRwandaSamoaSao Tome and PrincipeSaudi ArabiaSenegalSerbiaSeychellesSierra LeoneSingaporeSlovak RepublicSloveniaSmall statesSolomon IslandsSomaliaSouth AfricaSouth AsiaSouth Asia (IDA & IBRD)SpainSri LankaSt. Kitts and NevisSt. LuciaSt. Vincent and the GrenadinesSub-Saharan Africa Sub-Saharan Africa (excluding high income)Sub-Saharan Africa (IDA & IBRD countries)SudanSurinameSwedenSwitzerlandSyrian Arab RepublicTajikistanTanzaniaThailandTogoTongaTrinidad and TobagoTunisiaTurkeyTurkmenistanTuvaluUgandaUkraineUnited Arab EmiratesUnited KingdomUnited StatesUpper middle incomeUruguayUzbekistanVanuatuVenezuela, RBVietnamWorldYemen, Rep.ZambiaZimbabwe La ligne de temps
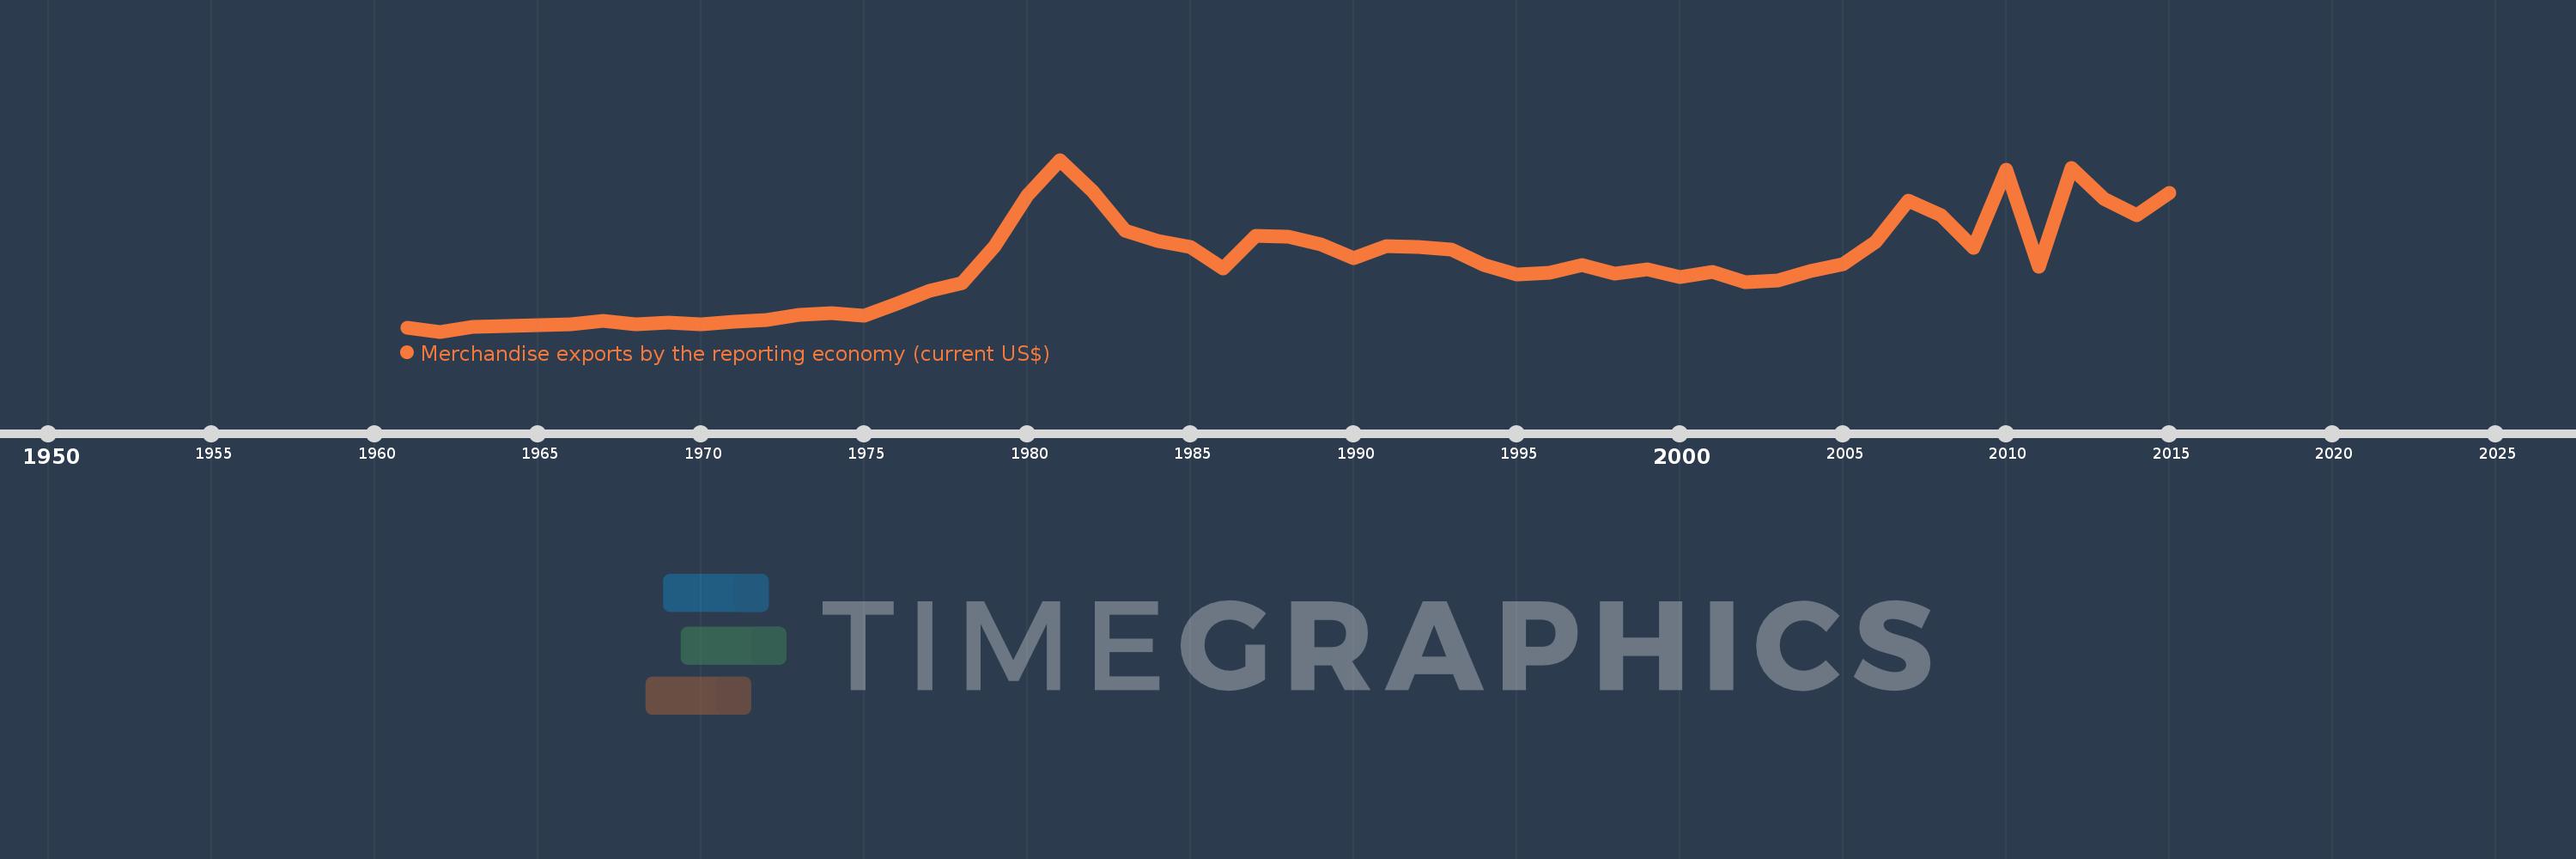
Cette échelle de temps montre un graphique de 1961 année à 2015 année Niger. Les données jusqu'à 1960 année ne sont pas présentés. Quantité d'observations actuelles selon dates: 55.
Source (désignation):
Les indicateurs du développement mondiale
Source (organisation):
World Bank staff estimates based data from International Monetary Fund's Direction of Trade database.
Catégories:
Private Sector, Trade
Dernière mise à jour
23 avr. 2017
Les indicateurs de changement de valeurs selon les années
Minimum:
200.0 milles
1 janv. 1962
Maximum:
566.509 mln.
1 janv. 1981
Pour la date d''observation
Valeur
Changement absolu
Le changement par rapport à la valeur précédente
1 janv. 1961
12.5 mln.
+12.5 mln.
0.0%
1 janv. 1962
200.0 milles
-12.3 mln.
-98.4%
1 janv. 1963
14.4 mln.
+14.2 mln.
7.1 milles%
1 janv. 1964
19.6 mln.
+5.2 mln.
36.11%
1 janv. 1965
21.2 mln.
+1.6 mln.
8.16%
1 janv. 1966
25.2 mln.
+4.0 mln.
18.87%
1 janv. 1967
34.8 mln.
+9.6 mln.
38.1%
1 janv. 1968
25.4 mln.
-9.4 mln.
-27.01%
1 janv. 1969
28.856 mln.
+3.456 mln.
13.61%
1 janv. 1970
24.371 mln.
-4.485 mln.
-15.54%
1 janv. 1971
31.661 mln.
+7.29 mln.
29.91%
1 janv. 1972
38.412 mln.
+6.751 mln.
21.32%
1 janv. 1973
54.158 mln.
+15.746 mln.
40.99%
1 janv. 1974
62.342 mln.
+8.184 mln.
15.11%
1 janv. 1975
52.733 mln.
-9.609 mln.
-15.41%
1 janv. 1976
91.247 mln.
+38.514 mln.
73.04%
1 janv. 1977
133.582 mln.
+42.335 mln.
46.4%
1 janv. 1978
160.656 mln.
+27.074 mln.
20.27%
1 janv. 1979
282.338 mln.
+121.682 mln.
75.74%
1 janv. 1980
449.014 mln.
+166.676 mln.
59.03%
1 janv. 1981
566.509 mln.
+117.495 mln.
26.17%
1 janv. 1982
464.338 mln.
-102.171 mln.
-18.04%
1 janv. 1983
332.08 mln.
-132.258 mln.
-28.48%
1 janv. 1984
298.893 mln.
-33.187 mln.
-9.99%
1 janv. 1985
279.489 mln.
-19.404 mln.
-6.49%
1 janv. 1986
209.026 mln.
-70.463 mln.
-25.21%
1 janv. 1987
316.613 mln.
+107.587 mln.
51.47%
1 janv. 1988
312.318 mln.
-4.295 mln.
-1.36%
1 janv. 1989
288.54 mln.
-23.778 mln.
-7.61%
1 janv. 1990
243.599 mln.
-44.941 mln.
-15.58%
1 janv. 1991
282.589 mln.
+38.99 mln.
16.01%
1 janv. 1992
277.717 mln.
-4.871 mln.
-1.72%
1 janv. 1993
271.013 mln.
-6.704 mln.
-2.41%
1 janv. 1994
220.859 mln.
-50.154 mln.
-18.51%
1 janv. 1995
187.887 mln.
-32.972 mln.
-14.93%
1 janv. 1996
192.776 mln.
+4.889 mln.
2.6%
1 janv. 1997
219.426 mln.
+26.65 mln.
13.82%
1 janv. 1998
192.268 mln.
-27.158 mln.
-12.38%
1 janv. 1999
206.137 mln.
+13.869 mln.
7.21%
1 janv. 2000
178.69 mln.
-27.448 mln.
-13.32%
1 janv. 2001
195.74 mln.
+17.05 mln.
9.54%
1 janv. 2002
162.395 mln.
-33.344 mln.
-17.04%
1 janv. 2003
168.632 mln.
+6.237 mln.
3.84%
1 janv. 2004
199.724 mln.
+31.091 mln.
18.44%
1 janv. 2005
222.46 mln.
+22.736 mln.
11.38%
1 janv. 2006
297.27 mln.
+74.81 mln.
33.63%
1 janv. 2007
430.612 mln.
+133.342 mln.
44.86%
1 janv. 2008
384.518 mln.
-46.094 mln.
-10.7%
1 janv. 2009
276.414 mln.
-108.104 mln.
-28.11%
1 janv. 2010
533.351 mln.
+256.937 mln.
92.95%
1 janv. 2011
214.502 mln.
-318.849 mln.
-59.78%
1 janv. 2012
539.411 mln.
+324.909 mln.
151.47%
1 janv. 2013
438.885 mln.
-100.526 mln.
-18.64%
1 janv. 2014
382.813 mln.
-56.072 mln.
-12.78%
1 janv. 2015
458.524 mln.
+75.71 mln.
19.78%
Classement des pays selon les statistiques actuelles par années


Commentaires: