29
/fr/
fr
AIzaSyAYiBZKx7MnpbEhh9jyipgxe19OcubqV5w
April 1, 2024
194506
Mauritius
MUS
true
2
1
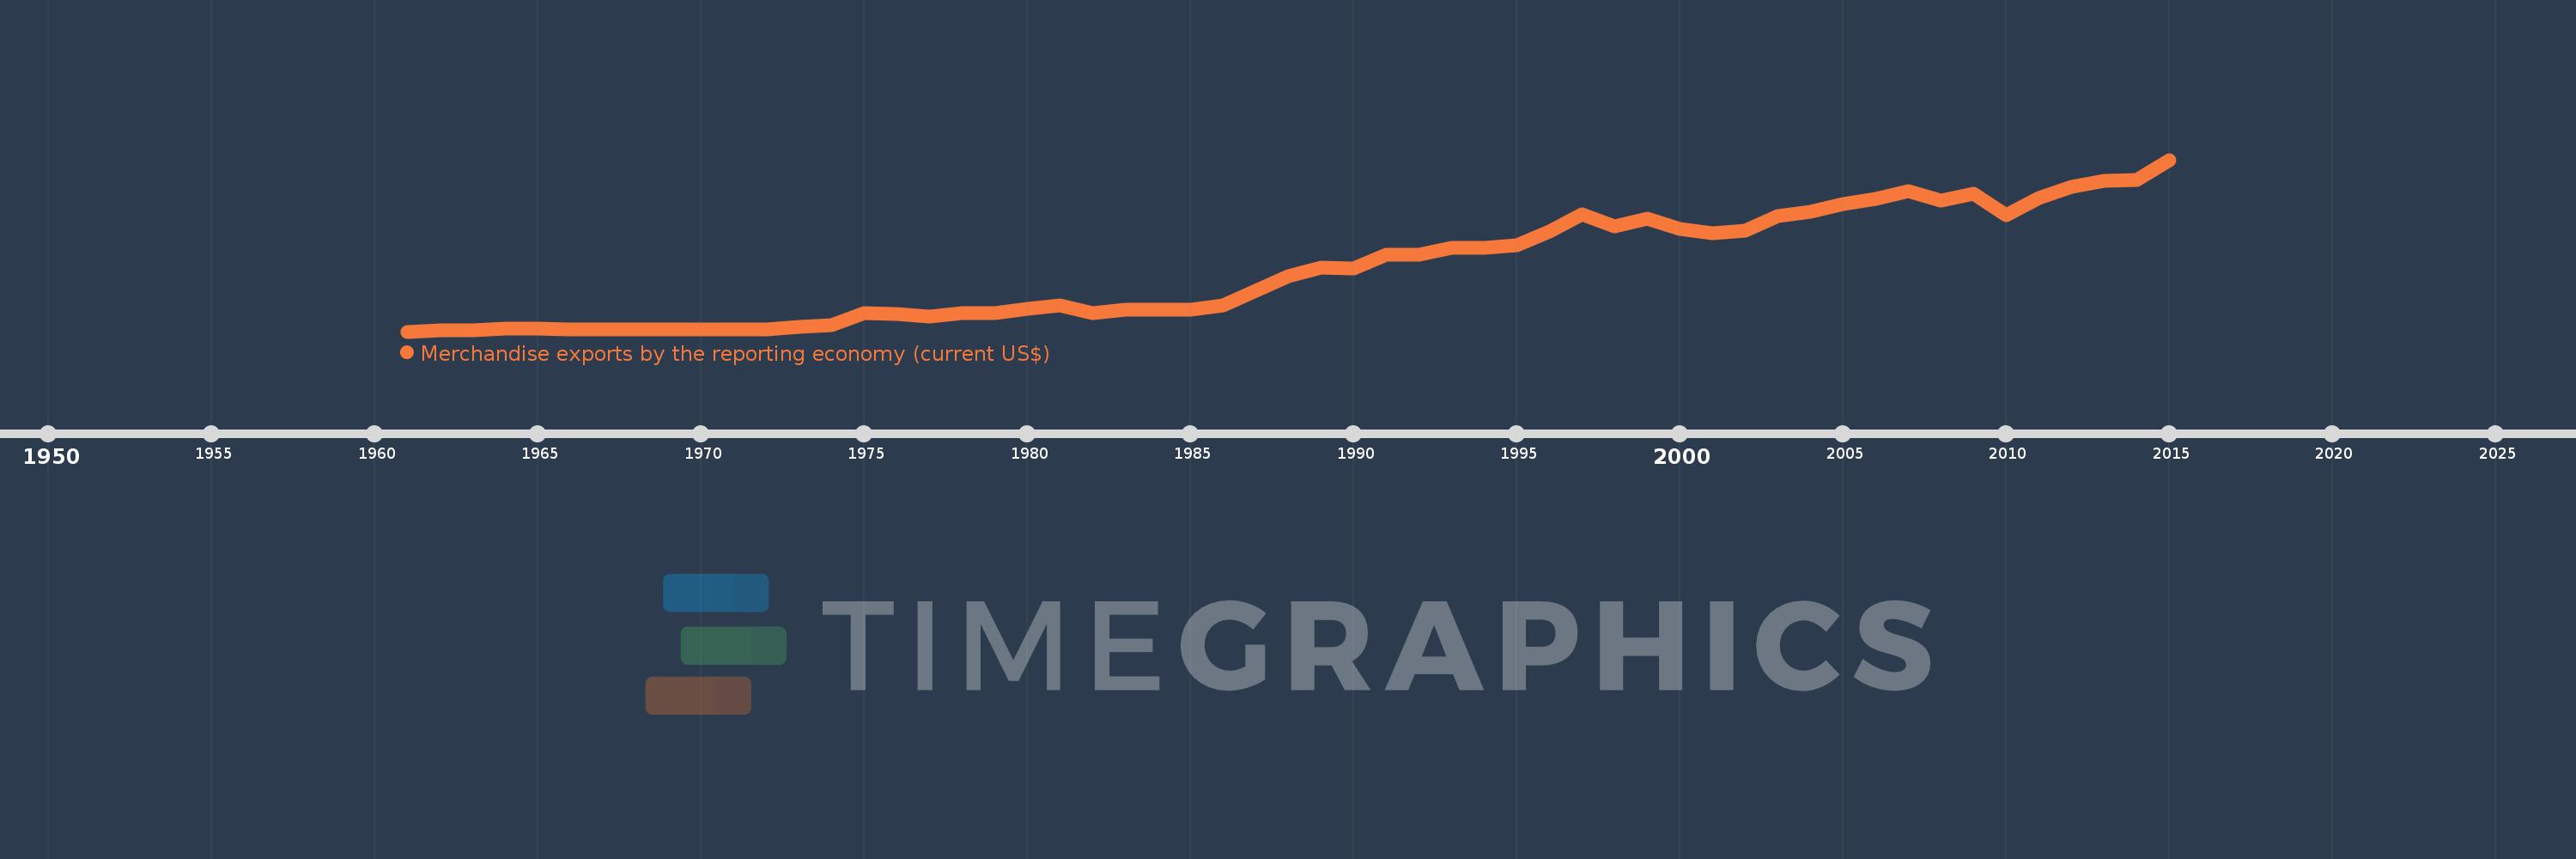
Merchandise exports by the reporting economy (current US$)
2015,2014,2013,2012,2011,2010,2009,2008,2007,2006,2005,2004,2003,2002,2001,2000,1999,1998,1997,1996,1995,1994,1993,1992,1991,1990,1989,1988,1987,1986,1985,1984,1983,1982,1981,1980,1979,1978,1977,1976,1975,1974,1973,1972,1971,1970,1969,1967,1966,1965,1964,1963,1962,1961
Cette statistique dans les autres pays:
AfghanistanAlbaniaAlgeriaAmerican SamoaAngolaAntigua and BarbudaArab WorldArgentinaArmeniaArubaAustraliaAustriaAzerbaijanBahamas, TheBahrainBangladeshBarbadosBelarusBelgiumBelizeBeninBermudaBoliviaBosnia and HerzegovinaBrazilBrunei DarussalamBulgariaBurkina FasoBurundiCabo VerdeCambodiaCameroonCanadaCaribbean small statesCentral African RepublicCentral Europe and the BalticsChadChileChinaColombiaComorosCongo, Dem. Rep.Congo, Rep.Costa RicaCote d'IvoireCroatiaCubaCyprusCzech RepublicDenmarkDjiboutiDominicaDominican RepublicEarly-demographic dividendEast Asia & PacificEast Asia & Pacific (excluding high income)East Asia & Pacific (IDA & IBRD countries)EcuadorEgypt, Arab Rep.El SalvadorEquatorial GuineaEstoniaEthiopiaEuro areaEurope & Central AsiaEurope & Central Asia (excluding high income)Europe & Central Asia (IDA & IBRD countries)European UnionFaroe IslandsFijiFinlandFragile and conflict affected situationsFranceFrench PolynesiaGabonGambia, TheGeorgiaGermanyGhanaGibraltarGreeceGreenlandGrenadaGuamGuatemalaGuineaGuinea-BissauGuyanaHaitiHeavily indebted poor countries (HIPC)High incomeHondurasHong Kong SAR, ChinaHungaryIBRD onlyIcelandIDA & IBRD totalIDA blendIDA onlyIDA totalIndiaIndonesiaIran, Islamic Rep.IraqIrelandIsraelItalyJamaicaJapanJordanKazakhstanKenyaKiribatiKorea, Dem. People’s Rep.Korea, Rep.KosovoKuwaitKyrgyz RepublicLao PDRLate-demographic dividendLatin America & Caribbean Latin America & Caribbean (excluding high income)Latin America & the Caribbean (IDA & IBRD countries)LatviaLeast developed countries: UN classificationLebanonLiberiaLibyaLithuaniaLow & middle incomeLow incomeLower middle incomeLuxembourgMacao SAR, ChinaMacedonia, FYRMadagascarMalawiMalaysiaMaldivesMaliMaltaMauritaniaMauritiusMexicoMiddle East & North AfricaMiddle East & North Africa (excluding high income)Middle East & North Africa (IDA & IBRD countries)Middle incomeMoldovaMongoliaMontenegroMoroccoMozambiqueMyanmarNauruNepalNetherlandsNew CaledoniaNew ZealandNicaraguaNigerNigeriaNorth AmericaNorwayOECD membersOmanOther small statesPacific island small statesPakistanPanamaPapua New GuineaParaguayPeruPhilippinesPolandPortugalPost-demographic dividendPre-demographic dividendQatarRomaniaRussian FederationRwandaSamoaSao Tome and PrincipeSaudi ArabiaSenegalSerbiaSeychellesSierra LeoneSingaporeSlovak RepublicSloveniaSmall statesSolomon IslandsSomaliaSouth AfricaSouth AsiaSouth Asia (IDA & IBRD)SpainSri LankaSt. Kitts and NevisSt. LuciaSt. Vincent and the GrenadinesSub-Saharan Africa Sub-Saharan Africa (excluding high income)Sub-Saharan Africa (IDA & IBRD countries)SudanSurinameSwedenSwitzerlandSyrian Arab RepublicTajikistanTanzaniaThailandTogoTongaTrinidad and TobagoTunisiaTurkeyTurkmenistanTuvaluUgandaUkraineUnited Arab EmiratesUnited KingdomUnited StatesUpper middle incomeUruguayUzbekistanVanuatuVenezuela, RBVietnamWorldYemen, Rep.ZambiaZimbabwe La ligne de temps
Cette échelle de temps montre un graphique de 1961 année à 2015 année Mauritius. Les données jusqu'à 1960 année ne sont pas présentés. Quantité d'observations actuelles selon dates: 54.
Source (désignation):
Les indicateurs du développement mondiale
Source (organisation):
World Bank staff estimates based data from International Monetary Fund's Direction of Trade database.
Catégories:
Private Sector, Trade
Dernière mise à jour
23 avr. 2017
Les indicateurs de changement de valeurs selon les années
Minimum:
38.8 mln.
1 janv. 1961
Maximum:
2.574 mds
1 janv. 2015
Pour la date d''observation
Valeur
Changement absolu
Le changement par rapport à la valeur précédente
1 janv. 1961
38.8 mln.
+38.8 mln.
0.0%
1 janv. 1962
60.4 mln.
+21.6 mln.
55.67%
1 janv. 1963
60.2 mln.
-200.0 milles
-0.33%
1 janv. 1964
83.0 mln.
+22.8 mln.
37.87%
1 janv. 1965
78.1 mln.
-4.9 mln.
-5.9%
1 janv. 1966
65.8 mln.
-12.3 mln.
-15.75%
1 janv. 1967
73.2 mln.
+7.4 mln.
11.25%
1 janv. 1969
66.3 mln.
-6.9 mln.
-9.43%
1 janv. 1970
65.024 mln.
-1.276 mln.
-1.92%
1 janv. 1971
70.934 mln.
+5.91 mln.
9.09%
1 janv. 1972
67.434 mln.
-3.5 mln.
-4.93%
1 janv. 1973
104.726 mln.
+37.292 mln.
55.3%
1 janv. 1974
131.398 mln.
+26.672 mln.
25.47%
1 janv. 1975
310.216 mln.
+178.818 mln.
136.09%
1 janv. 1976
295.239 mln.
-14.977 mln.
-4.83%
1 janv. 1977
261.824 mln.
-33.415 mln.
-11.32%
1 janv. 1978
306.351 mln.
+44.527 mln.
17.01%
1 janv. 1979
314.56 mln.
+8.209 mln.
2.68%
1 janv. 1980
371.149 mln.
+56.589 mln.
17.99%
1 janv. 1981
429.218 mln.
+58.069 mln.
15.65%
1 janv. 1982
317.438 mln.
-111.78 mln.
-26.04%
1 janv. 1983
358.687 mln.
+41.249 mln.
12.99%
1 janv. 1984
358.514 mln.
-173.0 milles
-0.05%
1 janv. 1985
365.957 mln.
+7.443 mln.
2.08%
1 janv. 1986
425.27 mln.
+59.313 mln.
16.21%
1 janv. 1987
646.284 mln.
+221.014 mln.
51.97%
1 janv. 1988
860.852 mln.
+214.568 mln.
33.2%
1 janv. 1989
980.746 mln.
+119.894 mln.
13.93%
1 janv. 1990
966.375 mln.
-14.371 mln.
-1.47%
1 janv. 1991
1.179 mds
+213.084 mln.
22.05%
1 janv. 1992
1.171 mds
-8.13 mln.
-0.69%
1 janv. 1993
1.272 mds
+100.324 mln.
8.56%
1 janv. 1994
1.275 mds
+3.731 mln.
0.29%
1 janv. 1995
1.315 mds
+39.289 mln.
3.08%
1 janv. 1996
1.511 mds
+196.056 mln.
14.91%
1 janv. 1997
1.767 mds
+256.203 mln.
16.96%
1 janv. 1998
1.595 mds
-171.607 mln.
-9.71%
1 janv. 1999
1.704 mds
+108.809 mln.
6.82%
1 janv. 2000
1.555 mds
-149.293 mln.
-8.76%
1 janv. 2001
1.488 mds
-66.617 mln.
-4.28%
1 janv. 2002
1.525 mds
+36.687 mln.
2.47%
1 janv. 2003
1.746 mds
+221.504 mln.
14.53%
1 janv. 2004
1.81 mds
+63.899 mln.
3.66%
1 janv. 2005
1.917 mds
+106.306 mln.
5.87%
1 janv. 2006
2.003 mds
+86.781 mln.
4.53%
1 janv. 2007
2.111 mds
+107.936 mln.
5.39%
1 janv. 2008
1.974 mds
-137.781 mln.
-6.53%
1 janv. 2009
2.074 mds
+100.583 mln.
5.1%
1 janv. 2010
1.76 mds
-313.639 mln.
-15.12%
1 janv. 2011
2.015 mds
+254.465 mln.
14.45%
1 janv. 2012
2.174 mds
+158.613 mln.
7.87%
1 janv. 2013
2.264 mds
+90.389 mln.
4.16%
1 janv. 2014
2.274 mds
+9.994 mln.
0.44%
1 janv. 2015
2.574 mds
+300.458 mln.
13.21%
Classement des pays selon les statistiques actuelles par années


Commentaires: