29
/es/
es
AIzaSyAYiBZKx7MnpbEhh9jyipgxe19OcubqV5w
April 1, 2024
96362
Burundi
BDI
true
2
1
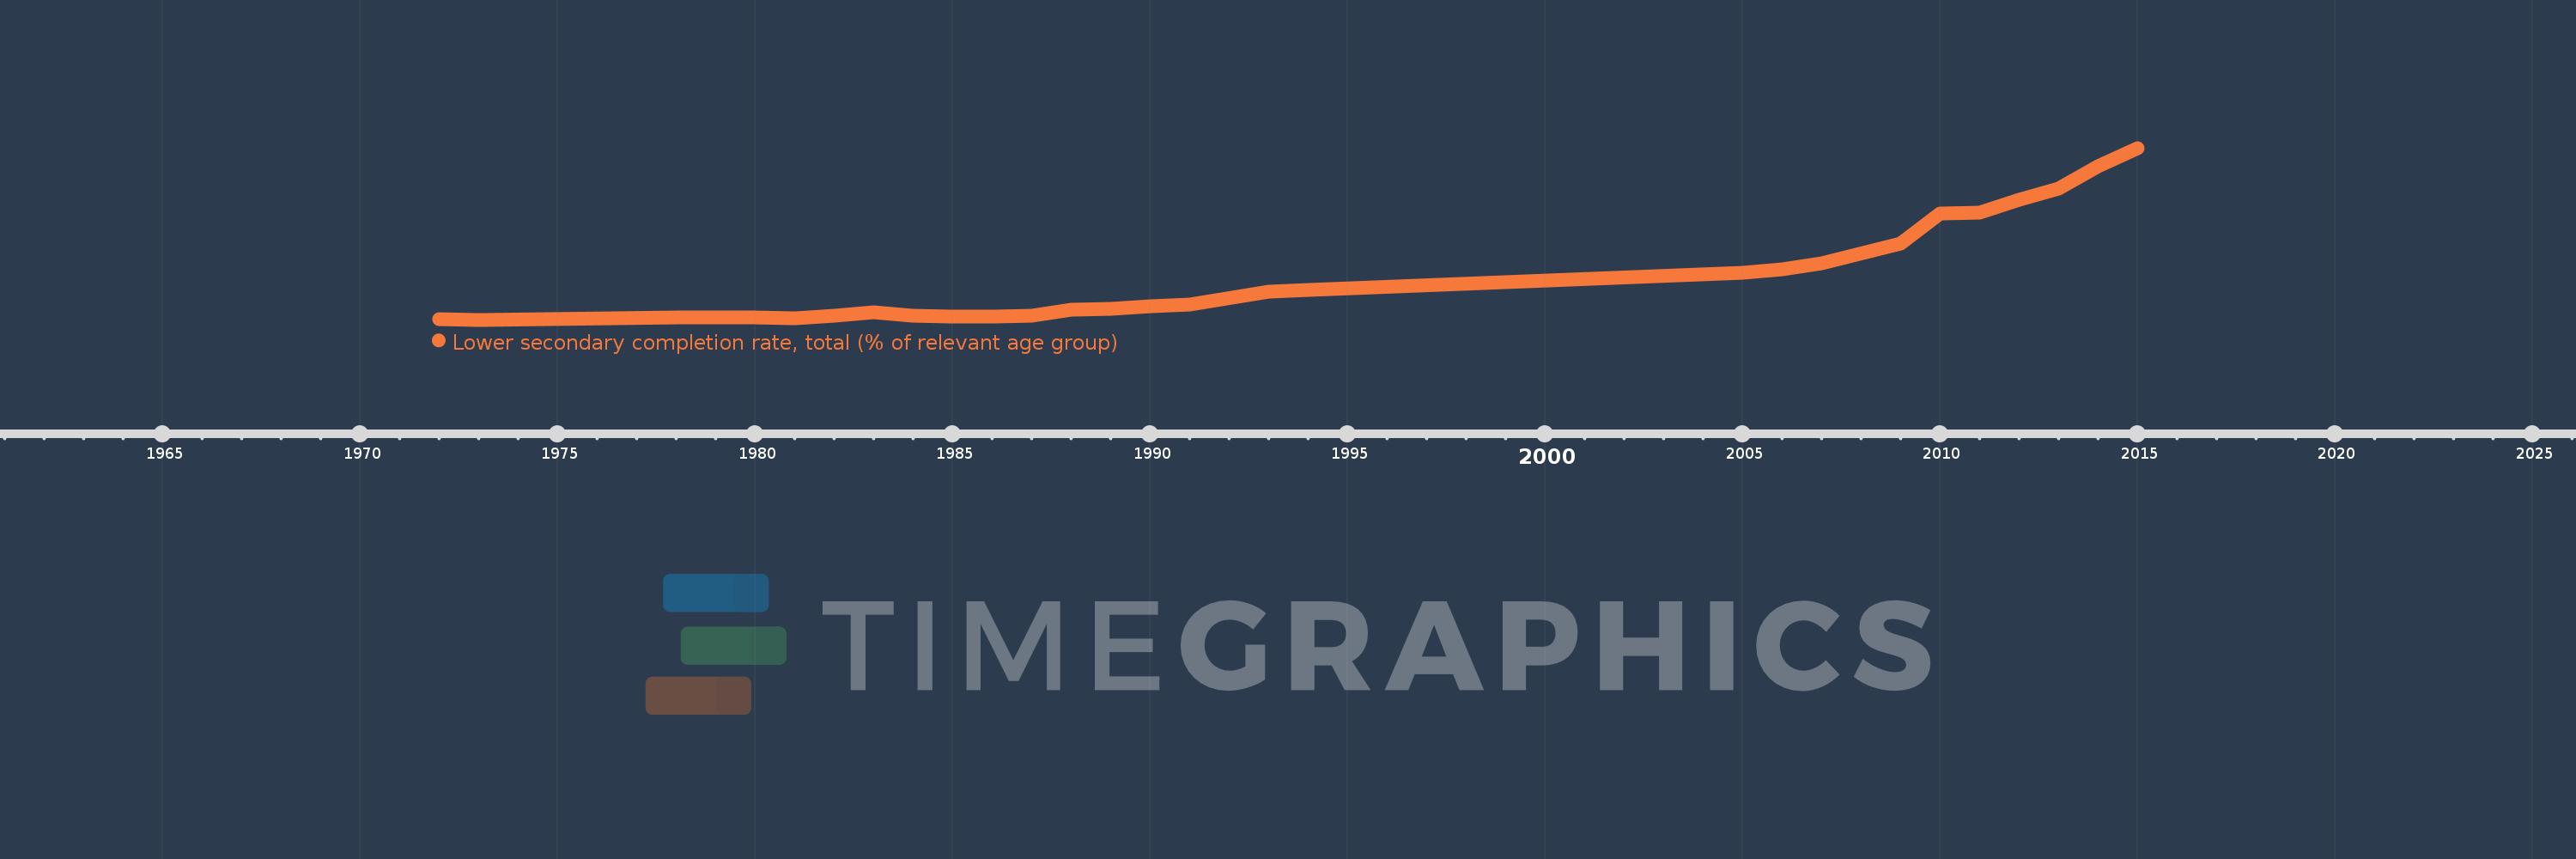
Lower secondary completion rate, total (% of relevant age group)
2015,2014,2013,2012,2011,2010,2009,2007,2006,2005,1994,1993,1991,1990,1989,1988,1987,1986,1985,1984,1983,1982,1981,1980,1979,1978,1973,1972
Estas estadísticas en otros países:
AfghanistanAlbaniaAlgeriaAngolaAntigua and BarbudaArab WorldArgentinaArmeniaArubaAustriaAzerbaijanBahamas, TheBahrainBangladeshBarbadosBelarusBelgiumBelizeBeninBermudaBhutanBoliviaBosnia and HerzegovinaBotswanaBrazilBritish Virgin IslandsBrunei DarussalamBulgariaBurkina FasoBurundiCabo VerdeCambodiaCameroonCaribbean small statesCentral African RepublicCentral Europe and the BalticsChadChileChinaColombiaComorosCongo, Dem. Rep.Congo, Rep.Costa RicaCote d'IvoireCroatiaCubaCyprusCzech RepublicDenmarkDjiboutiDominicaDominican RepublicEarly-demographic dividendEast Asia & PacificEast Asia & Pacific (excluding high income)East Asia & Pacific (IDA & IBRD countries)EcuadorEgypt, Arab Rep.El SalvadorEquatorial GuineaEritreaEstoniaEthiopiaEuro areaEurope & Central AsiaEurope & Central Asia (excluding high income)Europe & Central Asia (IDA & IBRD countries)European UnionFijiFinlandFragile and conflict affected situationsFranceGabonGambia, TheGeorgiaGermanyGhanaGreeceGrenadaGuatemalaGuineaGuinea-BissauGuyanaHaitiHeavily indebted poor countries (HIPC)High incomeHondurasHong Kong SAR, ChinaHungaryIBRD onlyIcelandIDA & IBRD totalIDA blendIDA onlyIDA totalIndiaIndonesiaIran, Islamic Rep.IraqIrelandIsraelItalyJamaicaJapanJordanKazakhstanKenyaKiribatiKorea, Dem. People’s Rep.Korea, Rep.KuwaitKyrgyz RepublicLao PDRLate-demographic dividendLatin America & Caribbean Latin America & Caribbean (excluding high income)Latin America & the Caribbean (IDA & IBRD countries)LatviaLeast developed countries: UN classificationLebanonLesothoLiberiaLiechtensteinLithuaniaLow & middle incomeLow incomeLower middle incomeLuxembourgMacao SAR, ChinaMacedonia, FYRMadagascarMalawiMalaysiaMaldivesMaliMaltaMarshall IslandsMauritaniaMauritiusMexicoMiddle East & North AfricaMiddle East & North Africa (excluding high income)Middle East & North Africa (IDA & IBRD countries)Middle incomeMoldovaMongoliaMontenegroMoroccoMozambiqueMyanmarNamibiaNauruNepalNetherlandsNicaraguaNigerNorwayOECD membersOmanOther small statesPacific island small statesPakistanPalauPanamaPapua New GuineaParaguayPeruPhilippinesPolandPortugalPost-demographic dividendPre-demographic dividendQatarRomaniaRussian FederationRwandaSamoaSan MarinoSao Tome and PrincipeSaudi ArabiaSenegalSerbiaSeychellesSierra LeoneSlovak RepublicSloveniaSmall statesSolomon IslandsSouth AfricaSouth AsiaSouth Asia (IDA & IBRD)South SudanSpainSri LankaSt. Kitts and NevisSt. LuciaSt. Vincent and the GrenadinesSub-Saharan Africa Sub-Saharan Africa (excluding high income)Sub-Saharan Africa (IDA & IBRD countries)SudanSurinameSwazilandSwedenSwitzerlandSyrian Arab RepublicTajikistanTanzaniaThailandTimor-LesteTogoTongaTrinidad and TobagoTunisiaTurkeyTuvaluUgandaUkraineUnited Arab EmiratesUpper middle incomeUruguayUzbekistanVanuatuVenezuela, RBVietnamWest Bank and GazaWorldYemen, Rep.ZambiaZimbabwe línea de tiempo (timeline):
En esta escala de tiempo se presenta un gráfico de 1972 y 2015 de Burundi. Los datos de 1971 están ausentes. El número de observaciones reales por fecha: 28.
Fuente (nombre):
Indicadores del desarrollo mundial
Fuente (organización):
United Nations Educational, Scientific, and Cultural Organization (UNESCO) Institute for Statistics.
Categorías:
Education
Se ha actualizado:
23 abr 2017 año
Los indicadores de los cambios de valor en los últimos años
Mínimo:
0.867
1 ene 1973 año
Máximo:
25.636
1 ene 2015 año
A la fecha de observación
Valor
Cambio absoluto
El cambio con respecto al valor anterior
1 ene 1972 año
0.973
+0.973
0.0%
1 ene 1973 año
0.867
-0.106
-10.94%
1 ene 1978 año
1.165
+0.298
34.36%
1 ene 1979 año
1.249
+0.084
7.2%
1 ene 1980 año
1.186
-0.063
-5.01%
1 ene 1981 año
1.124
-0.062
-5.21%
1 ene 1982 año
1.448
+0.324
28.83%
1 ene 1983 año
1.895
+0.447
30.84%
1 ene 1984 año
1.51
-0.385
-20.31%
1 ene 1985 año
1.34
-0.17
-11.26%
1 ene 1986 año
1.326
-0.014
-1.03%
1 ene 1987 año
1.413
+0.087
6.55%
1 ene 1988 año
2.285
+0.872
61.75%
1 ene 1989 año
2.498
+0.212
9.3%
1 ene 1990 año
2.759
+0.261
10.43%
1 ene 1991 año
3.004
+0.245
8.88%
1 ene 1993 año
4.925
+1.921
63.96%
1 ene 1994 año
5.115
+0.19
3.87%
1 ene 2005 año
7.689
+2.573
50.31%
1 ene 2006 año
8.082
+0.393
5.12%
1 ene 2007 año
8.955
+0.873
10.8%
1 ene 2009 año
11.878
+2.923
32.64%
1 ene 2010 año
16.193
+4.315
36.33%
1 ene 2011 año
16.344
+0.151
0.93%
1 ene 2012 año
18.12
+1.776
10.87%
1 ene 2013 año
19.758
+1.638
9.04%
1 ene 2014 año
23.042
+3.285
16.63%
1 ene 2015 año
25.636
+2.594
11.26%
Ranking de los países por los datos estadísticos actuales


Comentarios: