29
/es/
es
AIzaSyAYiBZKx7MnpbEhh9jyipgxe19OcubqV5w
April 1, 2024
248983
Sri Lanka
LKA
true
2
1
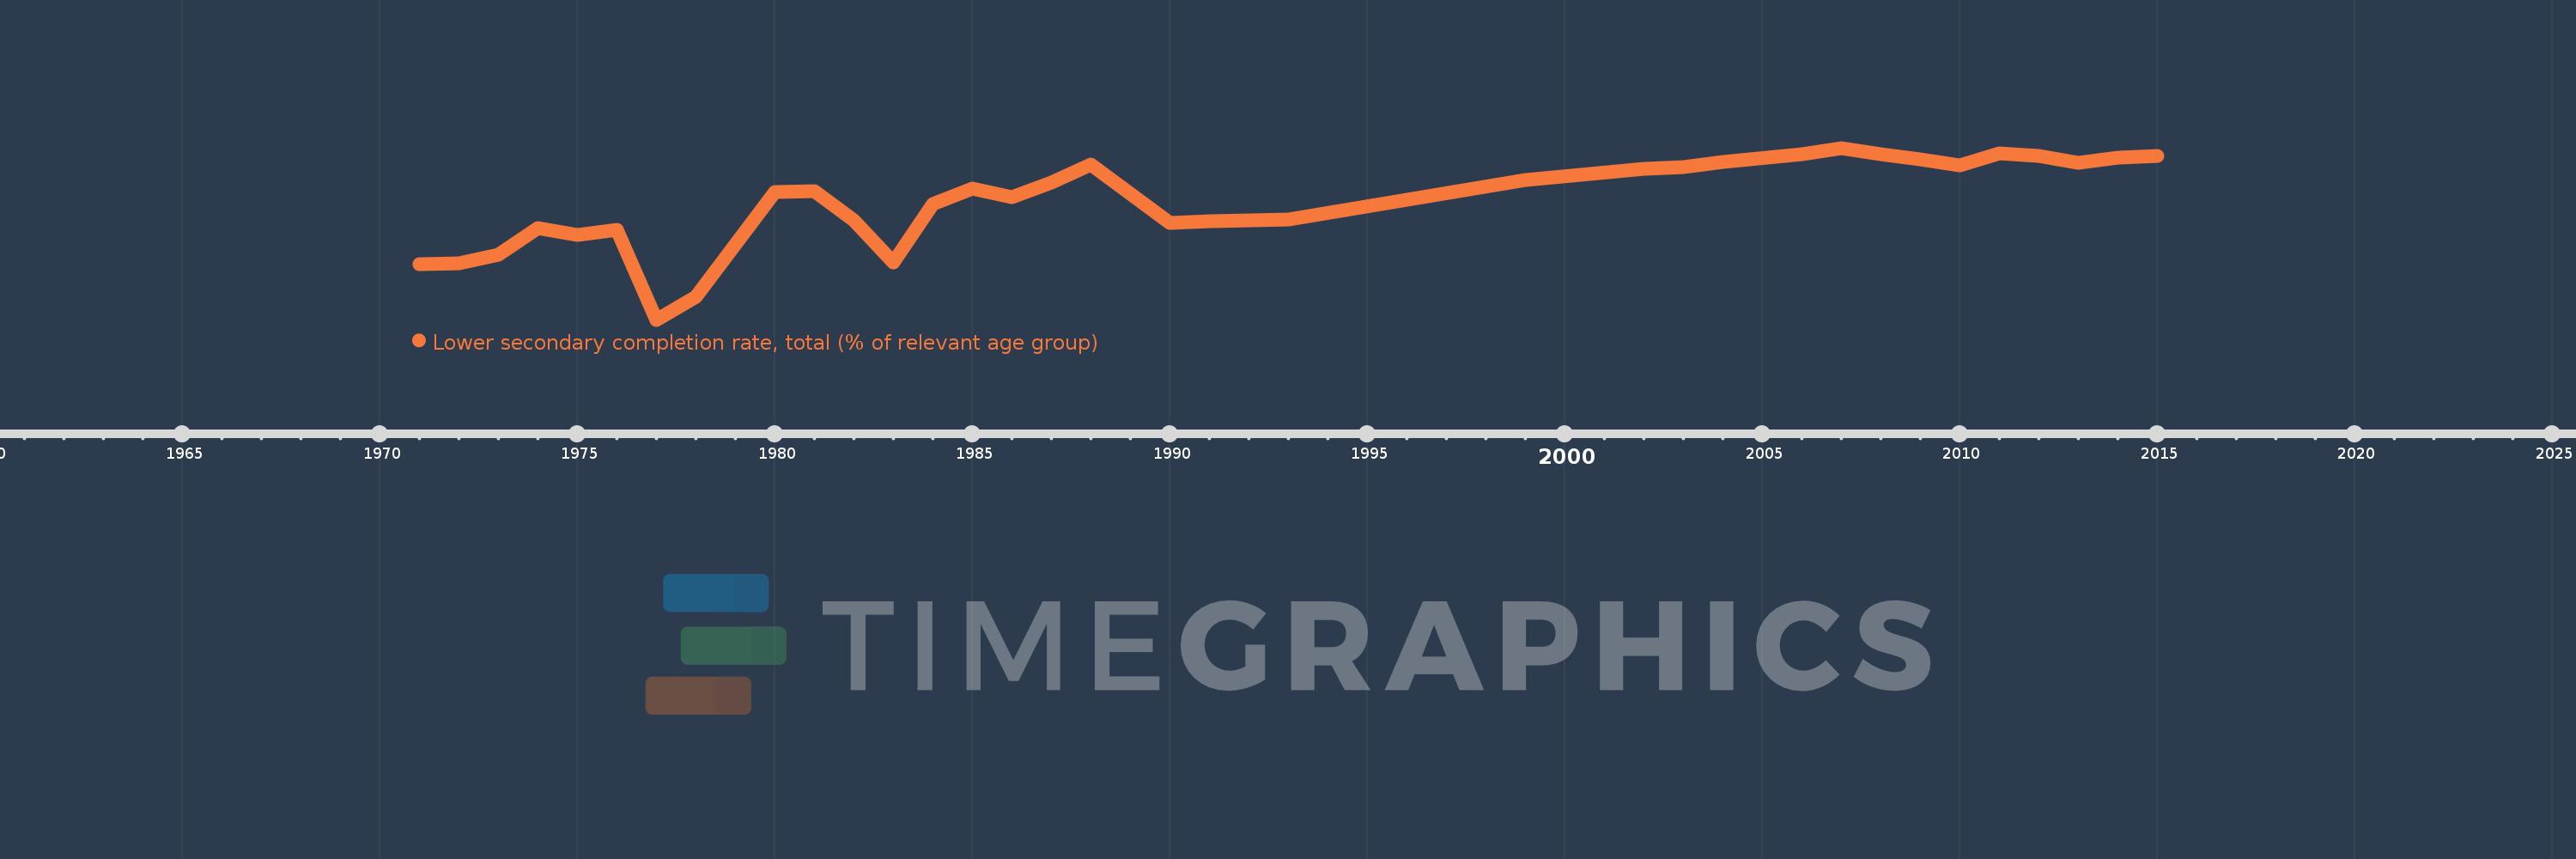
Lower secondary completion rate, total (% of relevant age group)
2015,2014,2013,2012,2011,2010,2009,2008,2007,2006,2004,2003,2002,1999,1993,1992,1991,1990,1988,1987,1986,1985,1984,1983,1982,1981,1980,1978,1977,1976,1975,1974,1973,1972,1971
Estas estadísticas en otros países:
AfghanistanAlbaniaAlgeriaAngolaAntigua and BarbudaArab WorldArgentinaArmeniaArubaAustriaAzerbaijanBahamas, TheBahrainBangladeshBarbadosBelarusBelgiumBelizeBeninBermudaBhutanBoliviaBosnia and HerzegovinaBotswanaBrazilBritish Virgin IslandsBrunei DarussalamBulgariaBurkina FasoBurundiCabo VerdeCambodiaCameroonCaribbean small statesCentral African RepublicCentral Europe and the BalticsChadChileChinaColombiaComorosCongo, Dem. Rep.Congo, Rep.Costa RicaCote d'IvoireCroatiaCubaCyprusCzech RepublicDenmarkDjiboutiDominicaDominican RepublicEarly-demographic dividendEast Asia & PacificEast Asia & Pacific (excluding high income)East Asia & Pacific (IDA & IBRD countries)EcuadorEgypt, Arab Rep.El SalvadorEquatorial GuineaEritreaEstoniaEthiopiaEuro areaEurope & Central AsiaEurope & Central Asia (excluding high income)Europe & Central Asia (IDA & IBRD countries)European UnionFijiFinlandFragile and conflict affected situationsFranceGabonGambia, TheGeorgiaGermanyGhanaGreeceGrenadaGuatemalaGuineaGuinea-BissauGuyanaHaitiHeavily indebted poor countries (HIPC)High incomeHondurasHong Kong SAR, ChinaHungaryIBRD onlyIcelandIDA & IBRD totalIDA blendIDA onlyIDA totalIndiaIndonesiaIran, Islamic Rep.IraqIrelandIsraelItalyJamaicaJapanJordanKazakhstanKenyaKiribatiKorea, Dem. People’s Rep.Korea, Rep.KuwaitKyrgyz RepublicLao PDRLate-demographic dividendLatin America & Caribbean Latin America & Caribbean (excluding high income)Latin America & the Caribbean (IDA & IBRD countries)LatviaLeast developed countries: UN classificationLebanonLesothoLiberiaLiechtensteinLithuaniaLow & middle incomeLow incomeLower middle incomeLuxembourgMacao SAR, ChinaMacedonia, FYRMadagascarMalawiMalaysiaMaldivesMaliMaltaMarshall IslandsMauritaniaMauritiusMexicoMiddle East & North AfricaMiddle East & North Africa (excluding high income)Middle East & North Africa (IDA & IBRD countries)Middle incomeMoldovaMongoliaMontenegroMoroccoMozambiqueMyanmarNamibiaNauruNepalNetherlandsNicaraguaNigerNorwayOECD membersOmanOther small statesPacific island small statesPakistanPalauPanamaPapua New GuineaParaguayPeruPhilippinesPolandPortugalPost-demographic dividendPre-demographic dividendQatarRomaniaRussian FederationRwandaSamoaSan MarinoSao Tome and PrincipeSaudi ArabiaSenegalSerbiaSeychellesSierra LeoneSlovak RepublicSloveniaSmall statesSolomon IslandsSouth AfricaSouth AsiaSouth Asia (IDA & IBRD)South SudanSpainSri LankaSt. Kitts and NevisSt. LuciaSt. Vincent and the GrenadinesSub-Saharan Africa Sub-Saharan Africa (excluding high income)Sub-Saharan Africa (IDA & IBRD countries)SudanSurinameSwazilandSwedenSwitzerlandSyrian Arab RepublicTajikistanTanzaniaThailandTimor-LesteTogoTongaTrinidad and TobagoTunisiaTurkeyTuvaluUgandaUkraineUnited Arab EmiratesUpper middle incomeUruguayUzbekistanVanuatuVenezuela, RBVietnamWest Bank and GazaWorldYemen, Rep.ZambiaZimbabwe línea de tiempo (timeline):
En esta escala de tiempo se presenta un gráfico de 1971 y 2015 de Sri Lanka. Los datos de 1970 están ausentes. El número de observaciones reales por fecha: 35.
Fuente (nombre):
Indicadores del desarrollo mundial
Fuente (organización):
United Nations Educational, Scientific, and Cultural Organization (UNESCO) Institute for Statistics.
Categorías:
Education
Se ha actualizado:
23 abr 2017 año
Los indicadores de los cambios de valor en los últimos años
Mínimo:
7.004
1 ene 1977 año
Máximo:
100.731
1 ene 2007 año
A la fecha de observación
Valor
Cambio absoluto
El cambio con respecto al valor anterior
1 ene 1971 año
37.302
+37.302
0.0%
1 ene 1972 año
37.649
+0.348
0.93%
1 ene 1973 año
42.424
+4.774
12.68%
1 ene 1974 año
57.132
+14.708
34.67%
1 ene 1975 año
53.218
-3.914
-6.85%
1 ene 1976 año
55.839
+2.621
4.93%
1 ene 1977 año
7.004
-48.835
-87.46%
1 ene 1978 año
19.649
+12.645
180.53%
1 ene 1980 año
76.543
+56.895
289.56%
1 ene 1981 año
77.153
+0.61
0.8%
1 ene 1982 año
61.371
-15.782
-20.45%
1 ene 1983 año
38.334
-23.037
-37.54%
1 ene 1984 año
69.93
+31.596
82.42%
1 ene 1985 año
78.72
+8.79
12.57%
1 ene 1986 año
73.735
-4.985
-6.33%
1 ene 1987 año
81.903
+8.167
11.08%
1 ene 1988 año
91.715
+9.812
11.98%
1 ene 1990 año
59.651
-32.064
-34.96%
1 ene 1991 año
60.866
+1.215
2.04%
1 ene 1992 año
61.122
+0.256
0.42%
1 ene 1993 año
61.467
+0.345
0.56%
1 ene 1999 año
83.427
+21.96
35.73%
1 ene 2002 año
89.45
+6.022
7.22%
1 ene 2003 año
90.422
+0.972
1.09%
1 ene 2004 año
93.175
+2.754
3.05%
1 ene 2006 año
97.095
+3.92
4.21%
1 ene 2007 año
100.731
+3.636
3.74%
1 ene 2008 año
97.341
-3.39
-3.37%
1 ene 2009 año
94.3
-3.042
-3.12%
1 ene 2010 año
91.413
-2.887
-3.06%
1 ene 2011 año
97.648
+6.235
6.82%
1 ene 2012 año
96.552
-1.096
-1.12%
1 ene 2013 año
92.49
-4.062
-4.21%
1 ene 2014 año
95.379
+2.889
3.12%
1 ene 2015 año
96.164
+0.785
0.82%
Ranking de los países por los datos estadísticos actuales


Comentarios: