29
/es/
es
AIzaSyAYiBZKx7MnpbEhh9jyipgxe19OcubqV5w
April 1, 2024
66259
Algeria
DZA
true
2
1
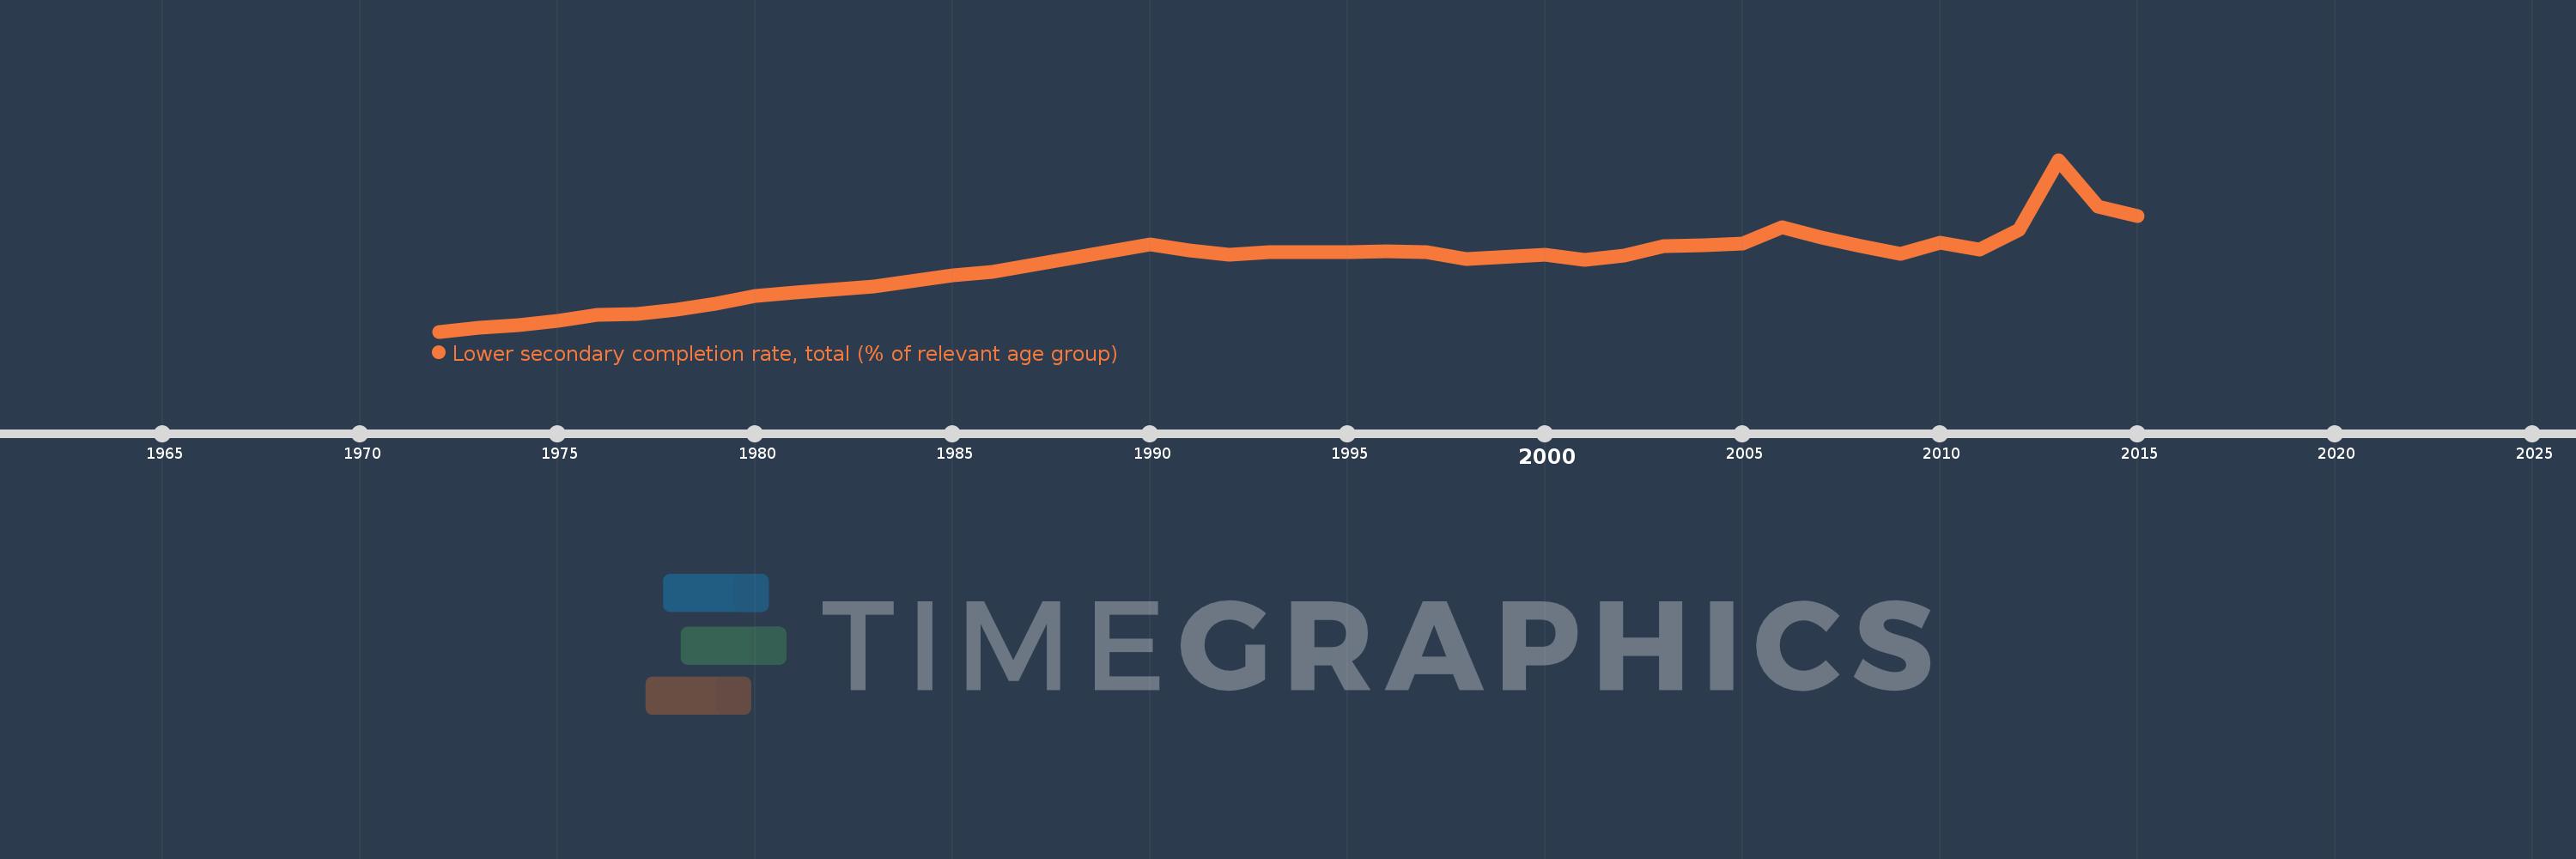
Lower secondary completion rate, total (% of relevant age group)
2015,2014,2013,2012,2011,2010,2009,2008,2007,2006,2005,2004,2003,2002,2001,2000,1998,1997,1996,1995,1994,1993,1992,1991,1990,1986,1985,1983,1981,1980,1979,1978,1977,1976,1975,1974,1973,1972
Estas estadísticas en otros países:
AfghanistanAlbaniaAlgeriaAngolaAntigua and BarbudaArab WorldArgentinaArmeniaArubaAustriaAzerbaijanBahamas, TheBahrainBangladeshBarbadosBelarusBelgiumBelizeBeninBermudaBhutanBoliviaBosnia and HerzegovinaBotswanaBrazilBritish Virgin IslandsBrunei DarussalamBulgariaBurkina FasoBurundiCabo VerdeCambodiaCameroonCaribbean small statesCentral African RepublicCentral Europe and the BalticsChadChileChinaColombiaComorosCongo, Dem. Rep.Congo, Rep.Costa RicaCote d'IvoireCroatiaCubaCyprusCzech RepublicDenmarkDjiboutiDominicaDominican RepublicEarly-demographic dividendEast Asia & PacificEast Asia & Pacific (excluding high income)East Asia & Pacific (IDA & IBRD countries)EcuadorEgypt, Arab Rep.El SalvadorEquatorial GuineaEritreaEstoniaEthiopiaEuro areaEurope & Central AsiaEurope & Central Asia (excluding high income)Europe & Central Asia (IDA & IBRD countries)European UnionFijiFinlandFragile and conflict affected situationsFranceGabonGambia, TheGeorgiaGermanyGhanaGreeceGrenadaGuatemalaGuineaGuinea-BissauGuyanaHaitiHeavily indebted poor countries (HIPC)High incomeHondurasHong Kong SAR, ChinaHungaryIBRD onlyIcelandIDA & IBRD totalIDA blendIDA onlyIDA totalIndiaIndonesiaIran, Islamic Rep.IraqIrelandIsraelItalyJamaicaJapanJordanKazakhstanKenyaKiribatiKorea, Dem. People’s Rep.Korea, Rep.KuwaitKyrgyz RepublicLao PDRLate-demographic dividendLatin America & Caribbean Latin America & Caribbean (excluding high income)Latin America & the Caribbean (IDA & IBRD countries)LatviaLeast developed countries: UN classificationLebanonLesothoLiberiaLiechtensteinLithuaniaLow & middle incomeLow incomeLower middle incomeLuxembourgMacao SAR, ChinaMacedonia, FYRMadagascarMalawiMalaysiaMaldivesMaliMaltaMarshall IslandsMauritaniaMauritiusMexicoMiddle East & North AfricaMiddle East & North Africa (excluding high income)Middle East & North Africa (IDA & IBRD countries)Middle incomeMoldovaMongoliaMontenegroMoroccoMozambiqueMyanmarNamibiaNauruNepalNetherlandsNicaraguaNigerNorwayOECD membersOmanOther small statesPacific island small statesPakistanPalauPanamaPapua New GuineaParaguayPeruPhilippinesPolandPortugalPost-demographic dividendPre-demographic dividendQatarRomaniaRussian FederationRwandaSamoaSan MarinoSao Tome and PrincipeSaudi ArabiaSenegalSerbiaSeychellesSierra LeoneSlovak RepublicSloveniaSmall statesSolomon IslandsSouth AfricaSouth AsiaSouth Asia (IDA & IBRD)South SudanSpainSri LankaSt. Kitts and NevisSt. LuciaSt. Vincent and the GrenadinesSub-Saharan Africa Sub-Saharan Africa (excluding high income)Sub-Saharan Africa (IDA & IBRD countries)SudanSurinameSwazilandSwedenSwitzerlandSyrian Arab RepublicTajikistanTanzaniaThailandTimor-LesteTogoTongaTrinidad and TobagoTunisiaTurkeyTuvaluUgandaUkraineUnited Arab EmiratesUpper middle incomeUruguayUzbekistanVanuatuVenezuela, RBVietnamWest Bank and GazaWorldYemen, Rep.ZambiaZimbabwe línea de tiempo (timeline):
En esta escala de tiempo se presenta un gráfico de 1972 y 2015 de Algeria. Los datos de 1971 están ausentes. El número de observaciones reales por fecha: 38.
Fuente (nombre):
Indicadores del desarrollo mundial
Fuente (organización):
United Nations Educational, Scientific, and Cultural Organization (UNESCO) Institute for Statistics.
Categorías:
Education
Se ha actualizado:
23 abr 2017 año
Los indicadores de los cambios de valor en los últimos años
Mínimo:
6.594
1 ene 1972 año
Máximo:
114.835
1 ene 2013 año
A la fecha de observación
Valor
Cambio absoluto
El cambio con respecto al valor anterior
1 ene 1972 año
6.594
+6.594
0.0%
1 ene 1973 año
8.9
+2.306
34.97%
1 ene 1974 año
10.671
+1.771
19.9%
1 ene 1975 año
13.366
+2.695
25.26%
1 ene 1976 año
17.075
+3.708
27.74%
1 ene 1977 año
17.603
+0.528
3.09%
1 ene 1978 año
20.333
+2.73
15.51%
1 ene 1979 año
24.314
+3.98
19.58%
1 ene 1980 año
28.939
+4.625
19.02%
1 ene 1981 año
30.991
+2.052
7.09%
1 ene 1983 año
35.09
+4.099
13.23%
1 ene 1985 año
41.827
+6.737
19.2%
1 ene 1986 año
44.238
+2.412
5.77%
1 ene 1990 año
61.56
+17.321
39.16%
1 ene 1991 año
57.864
-3.696
-6.0%
1 ene 1992 año
54.916
-2.948
-5.1%
1 ene 1993 año
56.908
+1.992
3.63%
1 ene 1994 año
56.423
-0.485
-0.85%
1 ene 1995 año
56.718
+0.295
0.52%
1 ene 1996 año
57.141
+0.423
0.75%
1 ene 1997 año
56.905
-0.236
-0.41%
1 ene 1998 año
52.288
-4.618
-8.11%
1 ene 2000 año
54.927
+2.639
5.05%
1 ene 2001 año
51.519
-3.408
-6.2%
1 ene 2002 año
54.445
+2.926
5.68%
1 ene 2003 año
60.337
+5.892
10.82%
1 ene 2004 año
61.133
+0.795
1.32%
1 ene 2005 año
62.094
+0.961
1.57%
1 ene 2006 año
72.377
+10.284
16.56%
1 ene 2007 año
66.076
-6.302
-8.71%
1 ene 2008 año
60.442
-5.634
-8.53%
1 ene 2009 año
55.373
-5.069
-8.39%
1 ene 2010 año
62.385
+7.012
12.66%
1 ene 2011 año
58.441
-3.943
-6.32%
1 ene 2012 año
70.607
+12.166
20.82%
1 ene 2013 año
114.835
+44.228
62.64%
1 ene 2014 año
85.382
-29.453
-25.65%
1 ene 2015 año
79.422
-5.96
-6.98%
Ranking de los países por los datos estadísticos actuales


Comentarios: