29
/es/
es
AIzaSyAYiBZKx7MnpbEhh9jyipgxe19OcubqV5w
April 1, 2024
113837
Cote d'Ivoire
CIV
true
2
1
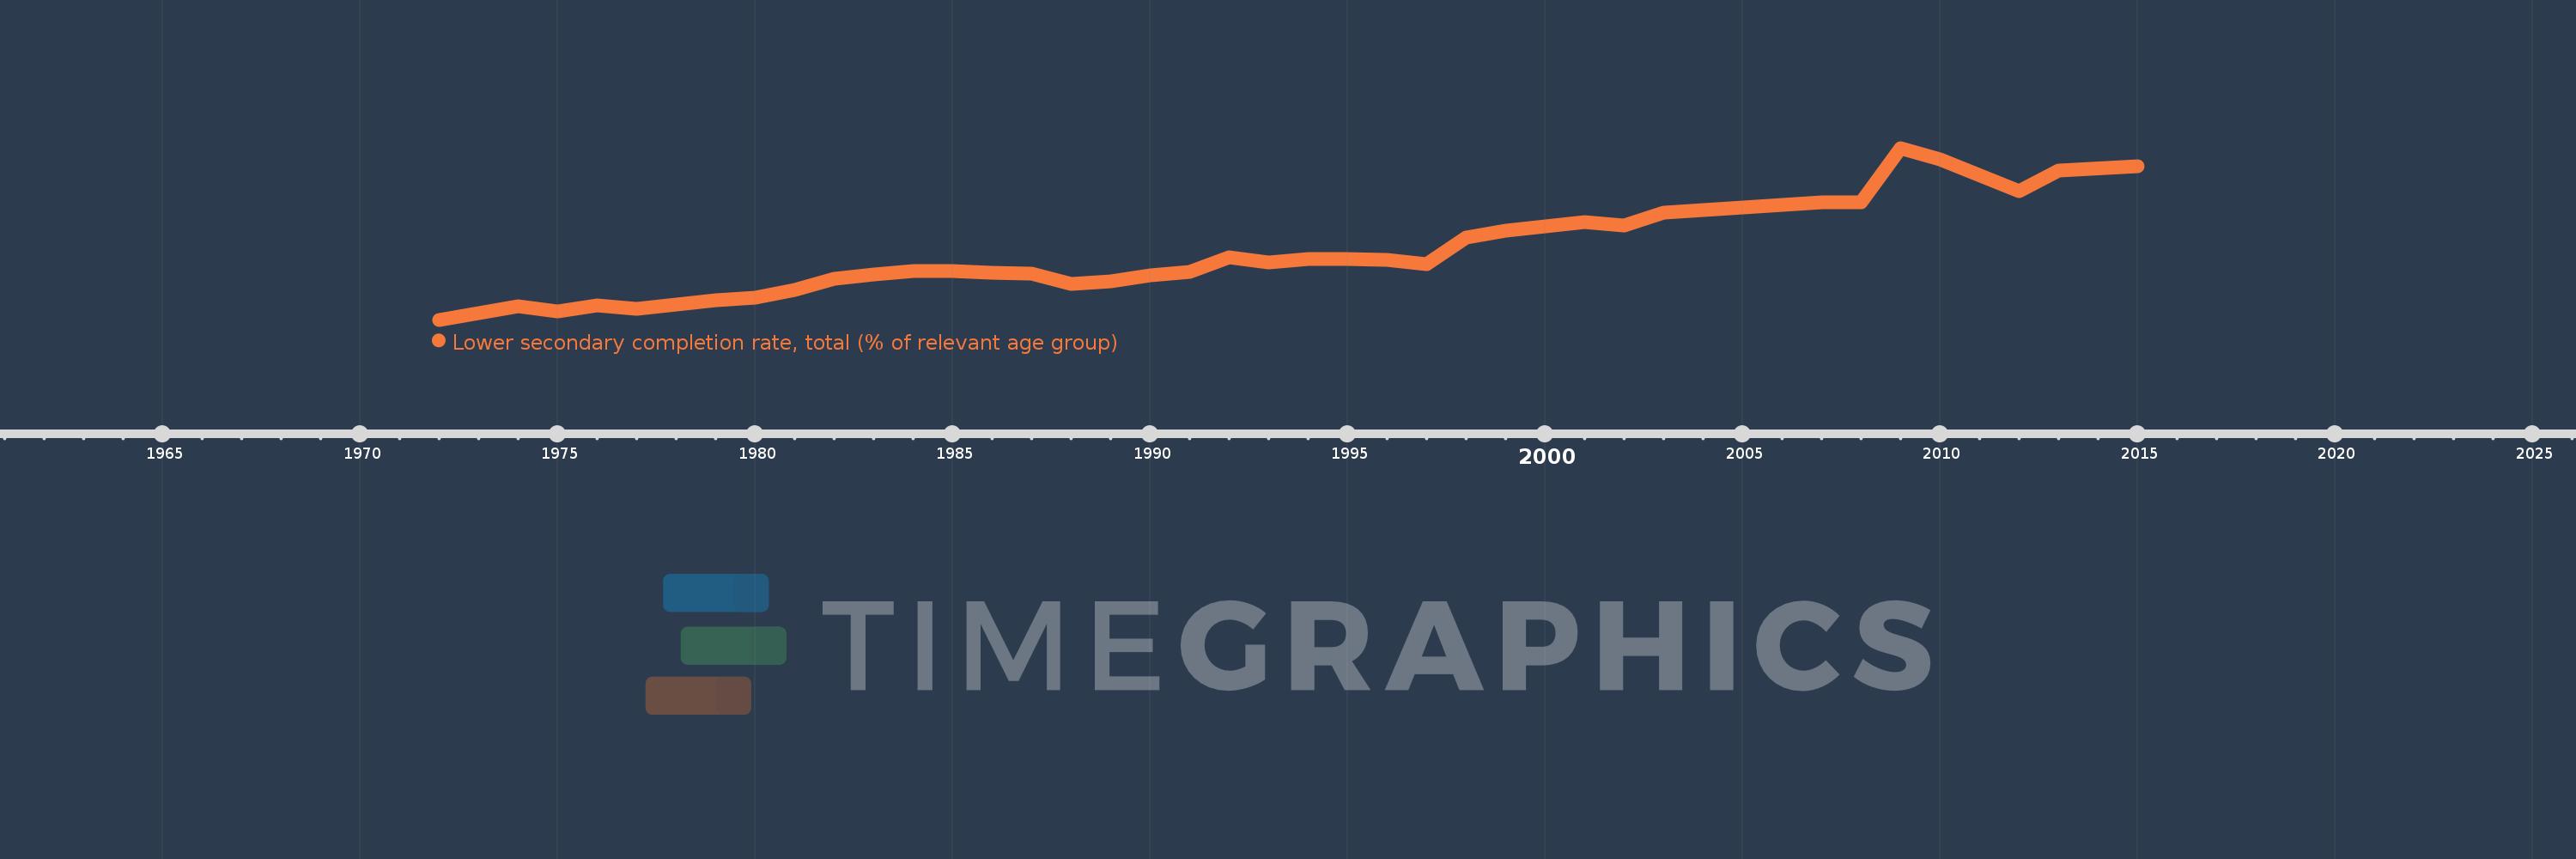
Lower secondary completion rate, total (% of relevant age group)
2015,2013,2012,2010,2009,2008,2007,2003,2002,2001,1999,1998,1997,1996,1995,1994,1993,1992,1991,1990,1989,1988,1987,1986,1985,1984,1983,1982,1981,1980,1979,1978,1977,1976,1975,1974,1972
Estas estadísticas en otros países:
AfghanistanAlbaniaAlgeriaAngolaAntigua and BarbudaArab WorldArgentinaArmeniaArubaAustriaAzerbaijanBahamas, TheBahrainBangladeshBarbadosBelarusBelgiumBelizeBeninBermudaBhutanBoliviaBosnia and HerzegovinaBotswanaBrazilBritish Virgin IslandsBrunei DarussalamBulgariaBurkina FasoBurundiCabo VerdeCambodiaCameroonCaribbean small statesCentral African RepublicCentral Europe and the BalticsChadChileChinaColombiaComorosCongo, Dem. Rep.Congo, Rep.Costa RicaCote d'IvoireCroatiaCubaCyprusCzech RepublicDenmarkDjiboutiDominicaDominican RepublicEarly-demographic dividendEast Asia & PacificEast Asia & Pacific (excluding high income)East Asia & Pacific (IDA & IBRD countries)EcuadorEgypt, Arab Rep.El SalvadorEquatorial GuineaEritreaEstoniaEthiopiaEuro areaEurope & Central AsiaEurope & Central Asia (excluding high income)Europe & Central Asia (IDA & IBRD countries)European UnionFijiFinlandFragile and conflict affected situationsFranceGabonGambia, TheGeorgiaGermanyGhanaGreeceGrenadaGuatemalaGuineaGuinea-BissauGuyanaHaitiHeavily indebted poor countries (HIPC)High incomeHondurasHong Kong SAR, ChinaHungaryIBRD onlyIcelandIDA & IBRD totalIDA blendIDA onlyIDA totalIndiaIndonesiaIran, Islamic Rep.IraqIrelandIsraelItalyJamaicaJapanJordanKazakhstanKenyaKiribatiKorea, Dem. People’s Rep.Korea, Rep.KuwaitKyrgyz RepublicLao PDRLate-demographic dividendLatin America & Caribbean Latin America & Caribbean (excluding high income)Latin America & the Caribbean (IDA & IBRD countries)LatviaLeast developed countries: UN classificationLebanonLesothoLiberiaLiechtensteinLithuaniaLow & middle incomeLow incomeLower middle incomeLuxembourgMacao SAR, ChinaMacedonia, FYRMadagascarMalawiMalaysiaMaldivesMaliMaltaMarshall IslandsMauritaniaMauritiusMexicoMiddle East & North AfricaMiddle East & North Africa (excluding high income)Middle East & North Africa (IDA & IBRD countries)Middle incomeMoldovaMongoliaMontenegroMoroccoMozambiqueMyanmarNamibiaNauruNepalNetherlandsNicaraguaNigerNorwayOECD membersOmanOther small statesPacific island small statesPakistanPalauPanamaPapua New GuineaParaguayPeruPhilippinesPolandPortugalPost-demographic dividendPre-demographic dividendQatarRomaniaRussian FederationRwandaSamoaSan MarinoSao Tome and PrincipeSaudi ArabiaSenegalSerbiaSeychellesSierra LeoneSlovak RepublicSloveniaSmall statesSolomon IslandsSouth AfricaSouth AsiaSouth Asia (IDA & IBRD)South SudanSpainSri LankaSt. Kitts and NevisSt. LuciaSt. Vincent and the GrenadinesSub-Saharan Africa Sub-Saharan Africa (excluding high income)Sub-Saharan Africa (IDA & IBRD countries)SudanSurinameSwazilandSwedenSwitzerlandSyrian Arab RepublicTajikistanTanzaniaThailandTimor-LesteTogoTongaTrinidad and TobagoTunisiaTurkeyTuvaluUgandaUkraineUnited Arab EmiratesUpper middle incomeUruguayUzbekistanVanuatuVenezuela, RBVietnamWest Bank and GazaWorldYemen, Rep.ZambiaZimbabwe línea de tiempo (timeline):
En esta escala de tiempo se presenta un gráfico de 1972 y 2015 de Cote d'Ivoire. Los datos de 1971 están ausentes. El número de observaciones reales por fecha: 37.
Fuente (nombre):
Indicadores del desarrollo mundial
Fuente (organización):
United Nations Educational, Scientific, and Cultural Organization (UNESCO) Institute for Statistics.
Categorías:
Education
Se ha actualizado:
23 abr 2017 año
Los indicadores de los cambios de valor en los últimos años
Mínimo:
8.95
1 ene 1972 año
Máximo:
35.383
1 ene 2009 año
A la fecha de observación
Valor
Cambio absoluto
El cambio con respecto al valor anterior
1 ene 1972 año
8.95
+8.95
0.0%
1 ene 1974 año
10.994
+2.044
22.84%
1 ene 1975 año
10.269
-0.726
-6.6%
1 ene 1976 año
11.194
+0.926
9.01%
1 ene 1977 año
10.567
-0.627
-5.6%
1 ene 1978 año
11.237
+0.67
6.34%
1 ene 1979 año
11.942
+0.706
6.28%
1 ene 1980 año
12.314
+0.372
3.11%
1 ene 1981 año
13.48
+1.165
9.46%
1 ene 1982 año
15.319
+1.839
13.65%
1 ene 1983 año
15.904
+0.585
3.82%
1 ene 1984 año
16.492
+0.588
3.7%
1 ene 1985 año
16.443
-0.049
-0.3%
1 ene 1986 año
16.225
-0.218
-1.33%
1 ene 1987 año
16.068
-0.157
-0.97%
1 ene 1988 año
14.504
-1.564
-9.73%
1 ene 1989 año
14.829
+0.325
2.24%
1 ene 1990 año
15.725
+0.895
6.04%
1 ene 1991 año
16.29
+0.565
3.59%
1 ene 1992 año
18.612
+2.322
14.25%
1 ene 1993 año
17.734
-0.877
-4.71%
1 ene 1994 año
18.322
+0.588
3.32%
1 ene 1995 año
18.277
-0.045
-0.24%
1 ene 1996 año
18.221
-0.057
-0.31%
1 ene 1997 año
17.481
-0.74
-4.06%
1 ene 1998 año
21.606
+4.125
23.6%
1 ene 1999 año
22.698
+1.092
5.05%
1 ene 2001 año
23.995
+1.297
5.72%
1 ene 2002 año
23.453
-0.542
-2.26%
1 ene 2003 año
25.389
+1.936
8.25%
1 ene 2007 año
26.971
+1.582
6.23%
1 ene 2008 año
27.047
+0.076
0.28%
1 ene 2009 año
35.383
+8.336
30.82%
1 ene 2010 año
33.589
-1.794
-5.07%
1 ene 2012 año
28.694
-4.895
-14.57%
1 ene 2013 año
31.971
+3.276
11.42%
1 ene 2015 año
32.522
+0.551
1.72%
Ranking de los países por los datos estadísticos actuales


Comentarios: