30
/es/
AIzaSyAYiBZKx7MnpbEhh9jyipgxe19OcubqV5w
April 1, 2024
215500
Oman
OMN
true
2
1
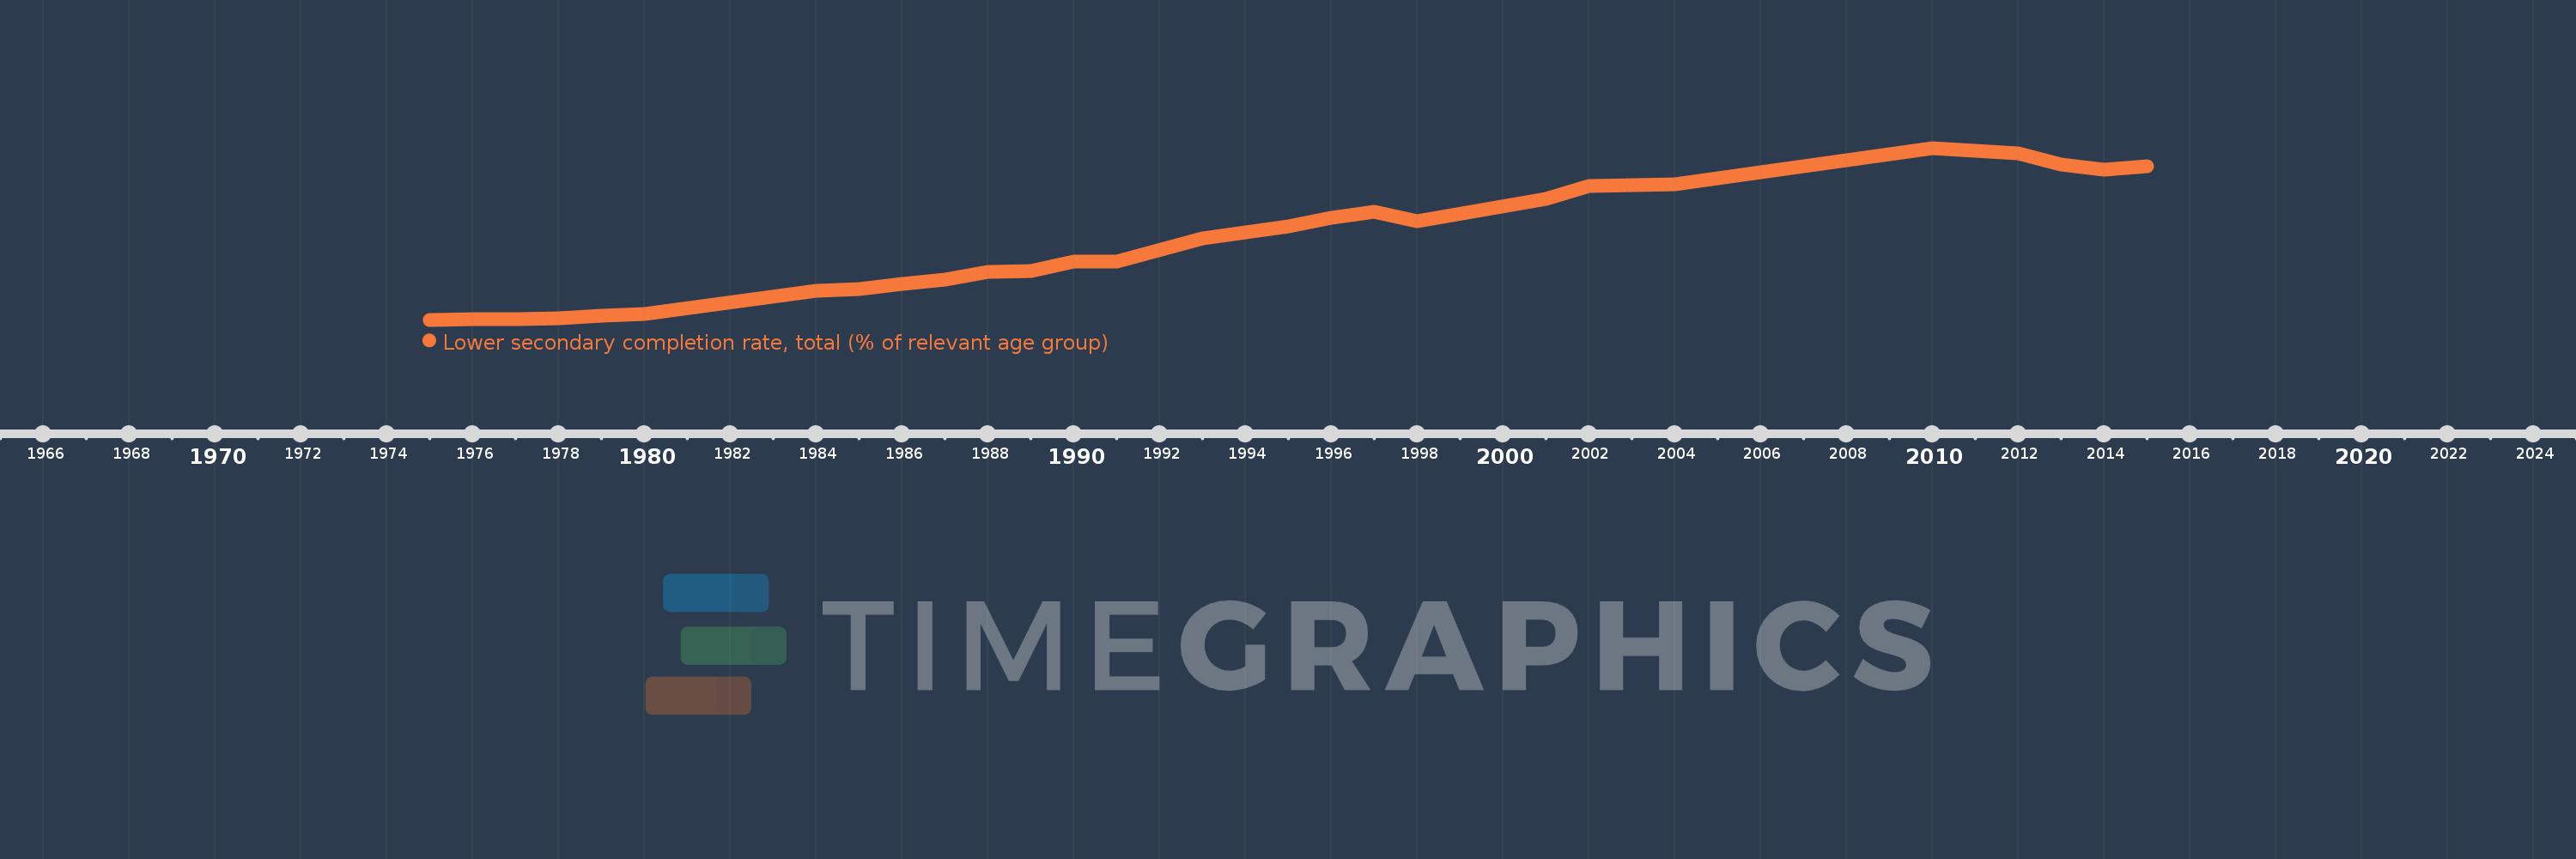
Lower secondary completion rate, total (% of relevant age group)
2015,2014,2013,2012,2010,2004,2003,2002,2001,1998,1997,1996,1995,1993,1991,1990,1989,1988,1987,1986,1985,1984,1980,1979,1978,1977,1976,1975
