29
/es/
es
AIzaSyAYiBZKx7MnpbEhh9jyipgxe19OcubqV5w
April 1, 2024
93621
Bulgaria
BGR
true
2
1
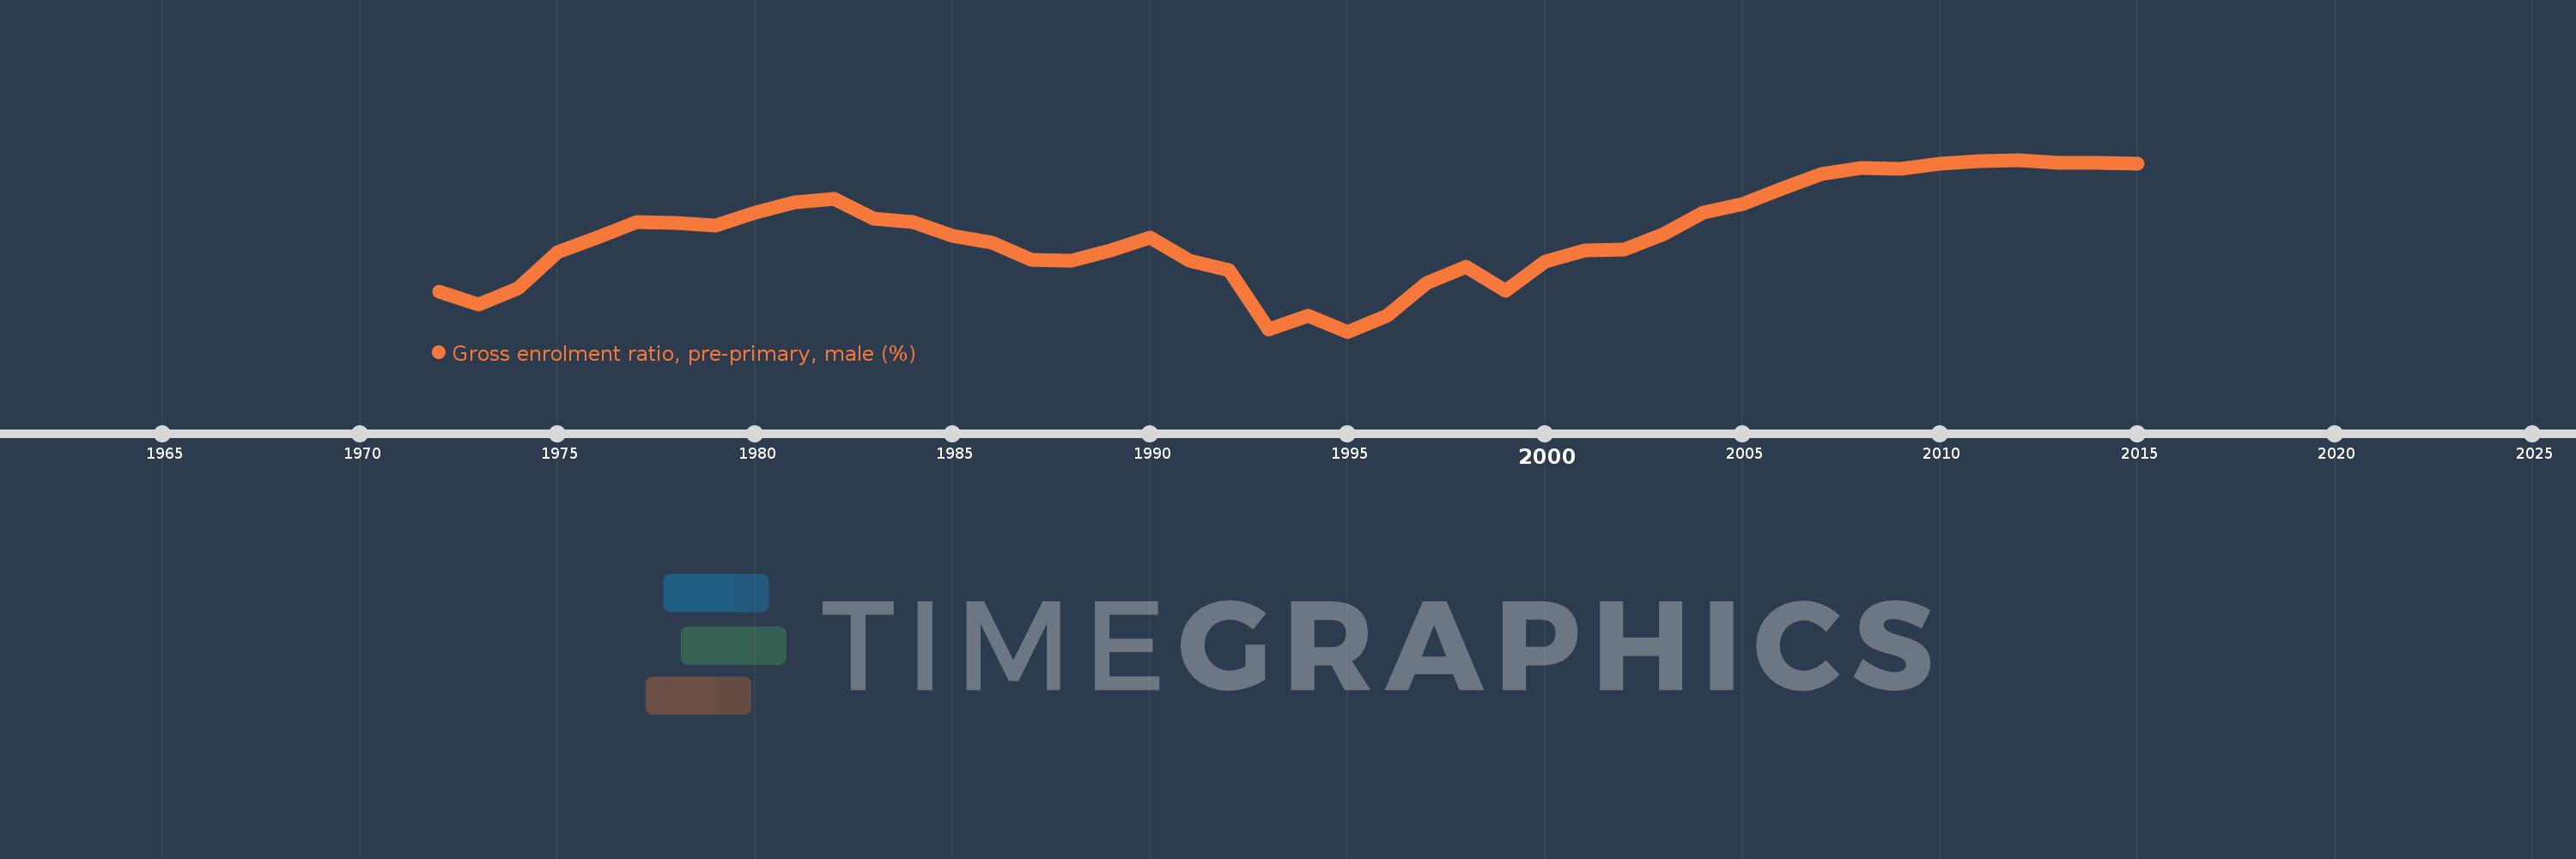
Gross enrolment ratio, pre-primary, male (%)
2015,2014,2013,2012,2011,2010,2009,2008,2007,2006,2005,2004,2003,2002,2001,2000,1999,1998,1997,1996,1995,1994,1993,1992,1991,1990,1989,1988,1987,1986,1985,1984,1983,1982,1981,1980,1979,1978,1977,1976,1975,1974,1973,1972
Estas estadísticas en otros países:
AfghanistanAlbaniaAlgeriaAndorraAngolaAntigua and BarbudaArab WorldArgentinaArmeniaArubaAustraliaAustriaAzerbaijanBahamas, TheBahrainBangladeshBarbadosBelarusBelgiumBelizeBeninBermudaBhutanBoliviaBosnia and HerzegovinaBotswanaBrazilBrunei DarussalamBulgariaBurkina FasoBurundiCabo VerdeCambodiaCameroonCanadaCaribbean small statesCentral African RepublicCentral Europe and the BalticsChadChileChinaColombiaComorosCongo, Dem. Rep.Congo, Rep.Costa RicaCote d'IvoireCroatiaCubaCyprusCzech RepublicDenmarkDjiboutiDominicaDominican RepublicEarly-demographic dividendEast Asia & PacificEast Asia & Pacific (excluding high income)East Asia & Pacific (IDA & IBRD countries)EcuadorEgypt, Arab Rep.El SalvadorEquatorial GuineaEritreaEstoniaEthiopiaEuro areaEurope & Central AsiaEurope & Central Asia (excluding high income)Europe & Central Asia (IDA & IBRD countries)European UnionFijiFinlandFragile and conflict affected situationsFranceGabonGambia, TheGeorgiaGermanyGhanaGreeceGrenadaGuatemalaGuineaGuinea-BissauGuyanaHeavily indebted poor countries (HIPC)High incomeHondurasHong Kong SAR, ChinaHungaryIBRD onlyIcelandIDA & IBRD totalIDA blendIDA onlyIDA totalIndiaIndonesiaIran, Islamic Rep.IraqIrelandIsraelItalyJamaicaJapanJordanKazakhstanKenyaKorea, Dem. People’s Rep.Korea, Rep.KuwaitKyrgyz RepublicLao PDRLate-demographic dividendLatin America & Caribbean Latin America & Caribbean (excluding high income)Latin America & the Caribbean (IDA & IBRD countries)LatviaLeast developed countries: UN classificationLebanonLesothoLiberiaLibyaLiechtensteinLithuaniaLow & middle incomeLow incomeLower middle incomeLuxembourgMacao SAR, ChinaMacedonia, FYRMadagascarMaldivesMaliMaltaMarshall IslandsMauritaniaMauritiusMexicoMicronesia, Fed. Sts.Middle East & North AfricaMiddle East & North Africa (excluding high income)Middle East & North Africa (IDA & IBRD countries)Middle incomeMoldovaMongoliaMontenegroMoroccoMozambiqueMyanmarNamibiaNauruNepalNetherlandsNew ZealandNicaraguaNigerNigeriaNorth AmericaNorwayOECD membersOmanOther small statesPacific island small statesPakistanPalauPanamaPapua New GuineaParaguayPeruPhilippinesPolandPortugalPost-demographic dividendPre-demographic dividendPuerto RicoQatarRomaniaRussian FederationRwandaSamoaSan MarinoSao Tome and PrincipeSaudi ArabiaSenegalSerbiaSeychellesSierra LeoneSlovak RepublicSloveniaSmall statesSolomon IslandsSomaliaSouth AfricaSouth AsiaSouth Asia (IDA & IBRD)South SudanSpainSri LankaSt. Kitts and NevisSt. LuciaSt. Vincent and the GrenadinesSub-Saharan Africa Sub-Saharan Africa (excluding high income)Sub-Saharan Africa (IDA & IBRD countries)SudanSurinameSwazilandSwedenSwitzerlandSyrian Arab RepublicTajikistanTanzaniaThailandTimor-LesteTogoTongaTrinidad and TobagoTunisiaTurkeyTurkmenistanTuvaluUgandaUkraineUnited Arab EmiratesUnited KingdomUnited StatesUpper middle incomeUruguayUzbekistanVanuatuVenezuela, RBVietnamWest Bank and GazaWorldYemen, Rep.Zimbabwe línea de tiempo (timeline):
En esta escala de tiempo se presenta un gráfico de 1972 y 2015 de Bulgaria. Los datos de 1971 están ausentes. El número de observaciones reales por fecha: 44.
Fuente (nombre):
Indicadores del desarrollo mundial
Fuente (organización):
UNESCO Institute for Statistics
Categorías:
Education, Gender
Se ha actualizado:
23 abr 2017 año
Los indicadores de los cambios de valor en los últimos años
Mínimo:
58.592
1 ene 1995 año
Máximo:
84.108
1 ene 2012 año
A la fecha de observación
Valor
Cambio absoluto
El cambio con respecto al valor anterior
1 ene 1972 año
64.549
+64.549
0.0%
1 ene 1973 año
62.579
-1.97
-3.05%
1 ene 1974 año
64.972
+2.393
3.82%
1 ene 1975 año
70.417
+5.445
8.38%
1 ene 1976 año
72.625
+2.208
3.14%
1 ene 1977 año
74.906
+2.28
3.14%
1 ene 1978 año
74.721
-0.185
-0.25%
1 ene 1979 año
74.304
-0.417
-0.56%
1 ene 1980 año
76.255
+1.952
2.63%
1 ene 1981 año
77.81
+1.555
2.04%
1 ene 1982 año
78.261
+0.451
0.58%
1 ene 1983 año
75.388
-2.873
-3.67%
1 ene 1984 año
74.917
-0.471
-0.62%
1 ene 1985 año
72.876
-2.041
-2.72%
1 ene 1986 año
71.845
-1.031
-1.41%
1 ene 1987 año
69.183
-2.662
-3.71%
1 ene 1988 año
69.087
-0.095
-0.14%
1 ene 1989 año
70.696
+1.609
2.33%
1 ene 1990 año
72.536
+1.841
2.6%
1 ene 1991 año
69.055
-3.482
-4.8%
1 ene 1992 año
67.722
-1.332
-1.93%
1 ene 1993 año
58.921
-8.802
-13.0%
1 ene 1994 año
60.938
+2.018
3.42%
1 ene 1995 año
58.592
-2.346
-3.85%
1 ene 1996 año
60.969
+2.377
4.06%
1 ene 1997 año
65.846
+4.876
8.0%
1 ene 1998 año
68.174
+2.328
3.54%
1 ene 1999 año
64.636
-3.538
-5.19%
1 ene 2000 año
68.981
+4.345
6.72%
1 ene 2001 año
70.647
+1.666
2.42%
1 ene 2002 año
70.768
+0.121
0.17%
1 ene 2003 año
73.112
+2.344
3.31%
1 ene 2004 año
76.239
+3.127
4.28%
1 ene 2005 año
77.559
+1.321
1.73%
1 ene 2006 año
79.819
+2.26
2.91%
1 ene 2007 año
82.018
+2.199
2.76%
1 ene 2008 año
82.84
+0.821
1.0%
1 ene 2009 año
82.806
-0.034
-0.04%
1 ene 2010 año
83.483
+0.677
0.82%
1 ene 2011 año
83.957
+0.475
0.57%
1 ene 2012 año
84.108
+0.151
0.18%
1 ene 2013 año
83.633
-0.476
-0.57%
1 ene 2014 año
83.634
+0.002
0.0%
1 ene 2015 año
83.49
-0.145
-0.17%
Ranking de los países por los datos estadísticos actuales


Comentarios: