29
/es/
es
AIzaSyAYiBZKx7MnpbEhh9jyipgxe19OcubqV5w
April 1, 2024
56264
Small states
SST
false
2
1
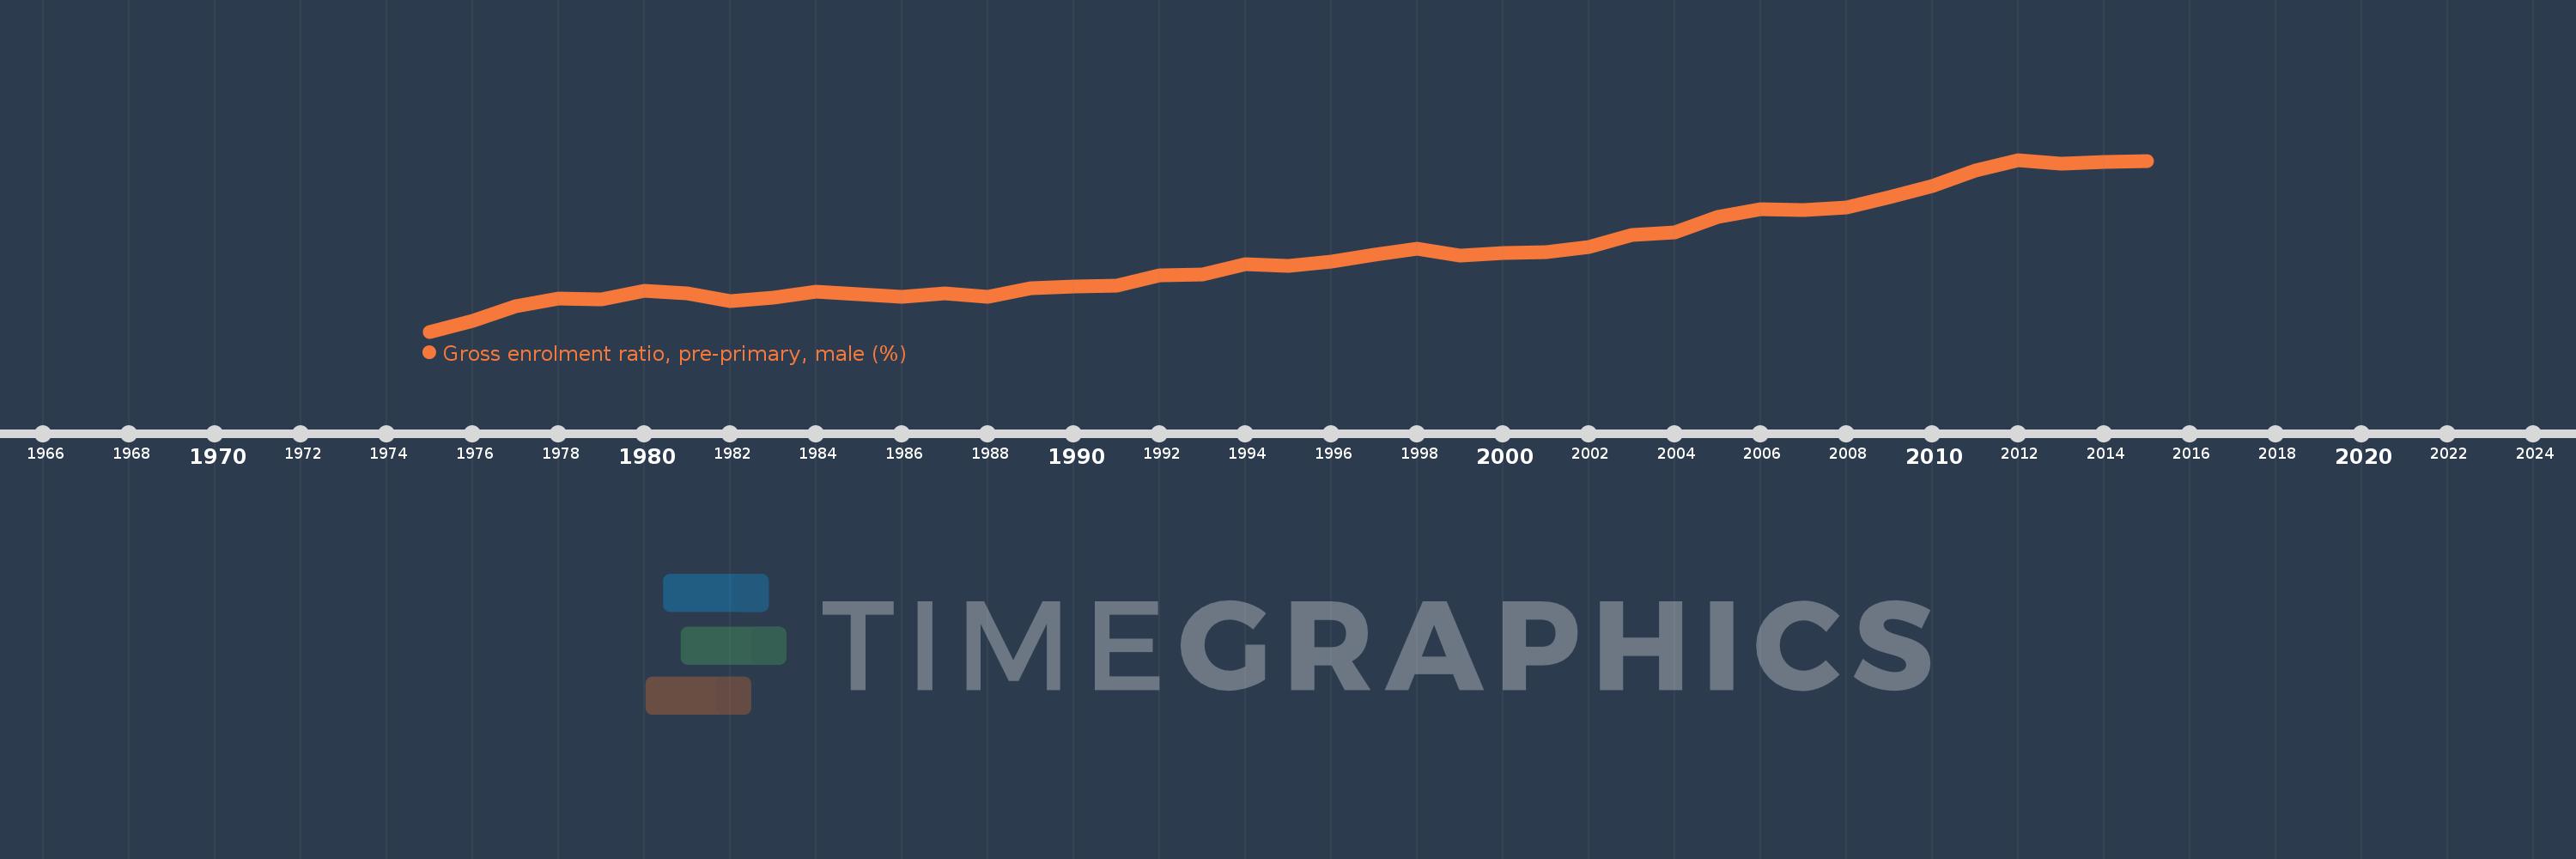
Gross enrolment ratio, pre-primary, male (%)
2015,2014,2013,2012,2011,2010,2009,2008,2007,2006,2005,2004,2003,2002,2001,2000,1999,1998,1997,1996,1995,1994,1993,1992,1991,1990,1989,1988,1987,1986,1985,1984,1983,1982,1981,1980,1979,1978,1977,1976,1975
Estas estadísticas en otros países:
AfghanistanAlbaniaAlgeriaAndorraAngolaAntigua and BarbudaArab WorldArgentinaArmeniaArubaAustraliaAustriaAzerbaijanBahamas, TheBahrainBangladeshBarbadosBelarusBelgiumBelizeBeninBermudaBhutanBoliviaBosnia and HerzegovinaBotswanaBrazilBrunei DarussalamBulgariaBurkina FasoBurundiCabo VerdeCambodiaCameroonCanadaCaribbean small statesCentral African RepublicCentral Europe and the BalticsChadChileChinaColombiaComorosCongo, Dem. Rep.Congo, Rep.Costa RicaCote d'IvoireCroatiaCubaCyprusCzech RepublicDenmarkDjiboutiDominicaDominican RepublicEarly-demographic dividendEast Asia & PacificEast Asia & Pacific (excluding high income)East Asia & Pacific (IDA & IBRD countries)EcuadorEgypt, Arab Rep.El SalvadorEquatorial GuineaEritreaEstoniaEthiopiaEuro areaEurope & Central AsiaEurope & Central Asia (excluding high income)Europe & Central Asia (IDA & IBRD countries)European UnionFijiFinlandFragile and conflict affected situationsFranceGabonGambia, TheGeorgiaGermanyGhanaGreeceGrenadaGuatemalaGuineaGuinea-BissauGuyanaHeavily indebted poor countries (HIPC)High incomeHondurasHong Kong SAR, ChinaHungaryIBRD onlyIcelandIDA & IBRD totalIDA blendIDA onlyIDA totalIndiaIndonesiaIran, Islamic Rep.IraqIrelandIsraelItalyJamaicaJapanJordanKazakhstanKenyaKorea, Dem. People’s Rep.Korea, Rep.KuwaitKyrgyz RepublicLao PDRLate-demographic dividendLatin America & Caribbean Latin America & Caribbean (excluding high income)Latin America & the Caribbean (IDA & IBRD countries)LatviaLeast developed countries: UN classificationLebanonLesothoLiberiaLibyaLiechtensteinLithuaniaLow & middle incomeLow incomeLower middle incomeLuxembourgMacao SAR, ChinaMacedonia, FYRMadagascarMaldivesMaliMaltaMarshall IslandsMauritaniaMauritiusMexicoMicronesia, Fed. Sts.Middle East & North AfricaMiddle East & North Africa (excluding high income)Middle East & North Africa (IDA & IBRD countries)Middle incomeMoldovaMongoliaMontenegroMoroccoMozambiqueMyanmarNamibiaNauruNepalNetherlandsNew ZealandNicaraguaNigerNigeriaNorth AmericaNorwayOECD membersOmanOther small statesPacific island small statesPakistanPalauPanamaPapua New GuineaParaguayPeruPhilippinesPolandPortugalPost-demographic dividendPre-demographic dividendPuerto RicoQatarRomaniaRussian FederationRwandaSamoaSan MarinoSao Tome and PrincipeSaudi ArabiaSenegalSerbiaSeychellesSierra LeoneSlovak RepublicSloveniaSmall statesSolomon IslandsSomaliaSouth AfricaSouth AsiaSouth Asia (IDA & IBRD)South SudanSpainSri LankaSt. Kitts and NevisSt. LuciaSt. Vincent and the GrenadinesSub-Saharan Africa Sub-Saharan Africa (excluding high income)Sub-Saharan Africa (IDA & IBRD countries)SudanSurinameSwazilandSwedenSwitzerlandSyrian Arab RepublicTajikistanTanzaniaThailandTimor-LesteTogoTongaTrinidad and TobagoTunisiaTurkeyTurkmenistanTuvaluUgandaUkraineUnited Arab EmiratesUnited KingdomUnited StatesUpper middle incomeUruguayUzbekistanVanuatuVenezuela, RBVietnamWest Bank and GazaWorldYemen, Rep.Zimbabwe línea de tiempo (timeline):
En esta escala de tiempo se presenta un gráfico de 1975 y 2015 de Small states. Los datos de 1974 están ausentes. El número de observaciones reales por fecha: 41.
Fuente (nombre):
Indicadores del desarrollo mundial
Fuente (organización):
UNESCO Institute for Statistics
Categorías:
Education, Gender
Se ha actualizado:
23 abr 2017 año
Los indicadores de los cambios de valor en los últimos años
Mínimo:
25.934
1 ene 1975 año
Máximo:
44.665
1 ene 2012 año
A la fecha de observación
Valor
Cambio absoluto
El cambio con respecto al valor anterior
1 ene 1975 año
25.934
+25.934
0.0%
1 ene 1976 año
27.149
+1.216
4.69%
1 ene 1977 año
28.681
+1.532
5.64%
1 ene 1978 año
29.582
+0.901
3.14%
1 ene 1979 año
29.418
-0.165
-0.56%
1 ene 1980 año
30.425
+1.008
3.43%
1 ene 1981 año
30.104
-0.321
-1.05%
1 ene 1982 año
29.289
-0.815
-2.71%
1 ene 1983 año
29.631
+0.342
1.17%
1 ene 1984 año
30.279
+0.648
2.19%
1 ene 1985 año
29.998
-0.281
-0.93%
1 ene 1986 año
29.733
-0.265
-0.88%
1 ene 1987 año
30.09
+0.357
1.2%
1 ene 1988 año
29.699
-0.391
-1.3%
1 ene 1989 año
30.664
+0.966
3.25%
1 ene 1990 año
30.838
+0.173
0.57%
1 ene 1991 año
30.943
+0.105
0.34%
1 ene 1992 año
32.106
+1.163
3.76%
1 ene 1993 año
32.127
+0.021
0.06%
1 ene 1994 año
33.278
+1.151
3.58%
1 ene 1995 año
33.063
-0.215
-0.65%
1 ene 1996 año
33.551
+0.488
1.48%
1 ene 1997 año
34.295
+0.744
2.22%
1 ene 1998 año
34.968
+0.674
1.96%
1 ene 1999 año
34.265
-0.704
-2.01%
1 ene 2000 año
34.534
+0.269
0.79%
1 ene 2001 año
34.588
+0.054
0.16%
1 ene 2002 año
35.198
+0.61
1.76%
1 ene 2003 año
36.44
+1.242
3.53%
1 ene 2004 año
36.741
+0.301
0.83%
1 ene 2005 año
38.418
+1.677
4.56%
1 ene 2006 año
39.234
+0.817
2.13%
1 ene 2007 año
39.222
-0.012
-0.03%
1 ene 2008 año
39.489
+0.267
0.68%
1 ene 2009 año
40.545
+1.056
2.67%
1 ene 2010 año
41.762
+1.217
3.0%
1 ene 2011 año
43.489
+1.727
4.14%
1 ene 2012 año
44.665
+1.176
2.7%
1 ene 2013 año
44.205
-0.46
-1.03%
1 ene 2014 año
44.448
+0.242
0.55%
1 ene 2015 año
44.512
+0.064
0.14%
Ranking de los países por los datos estadísticos actuales


Comentarios: