29
/es/
es
AIzaSyAYiBZKx7MnpbEhh9jyipgxe19OcubqV5w
April 1, 2024
152585
Hungary
HUN
true
2
1
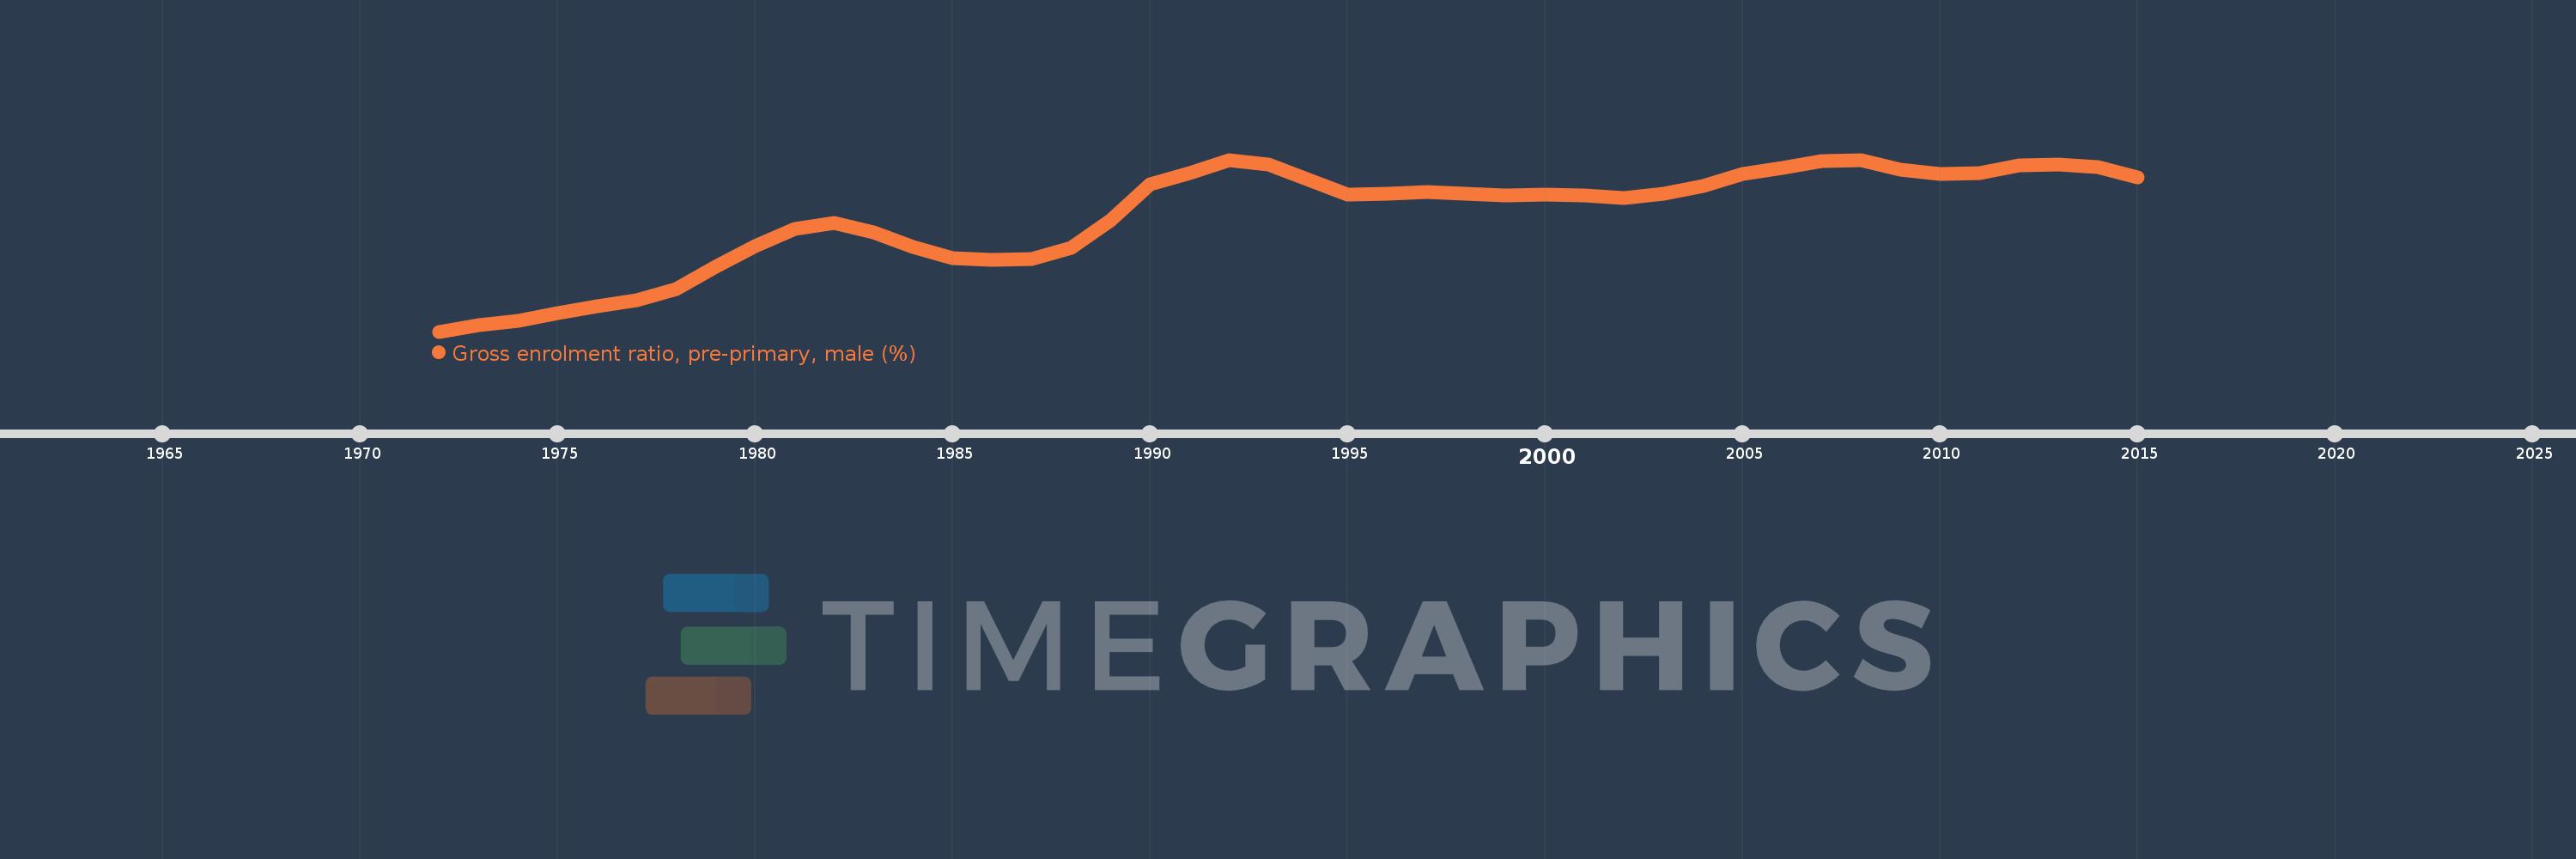
Gross enrolment ratio, pre-primary, male (%)
2015,2014,2013,2012,2011,2010,2009,2008,2007,2006,2005,2004,2003,2002,2001,2000,1999,1998,1997,1996,1995,1993,1992,1991,1990,1989,1988,1987,1986,1985,1984,1983,1982,1981,1980,1979,1978,1977,1976,1975,1974,1973,1972
Estas estadísticas en otros países:
AfghanistanAlbaniaAlgeriaAndorraAngolaAntigua and BarbudaArab WorldArgentinaArmeniaArubaAustraliaAustriaAzerbaijanBahamas, TheBahrainBangladeshBarbadosBelarusBelgiumBelizeBeninBermudaBhutanBoliviaBosnia and HerzegovinaBotswanaBrazilBrunei DarussalamBulgariaBurkina FasoBurundiCabo VerdeCambodiaCameroonCanadaCaribbean small statesCentral African RepublicCentral Europe and the BalticsChadChileChinaColombiaComorosCongo, Dem. Rep.Congo, Rep.Costa RicaCote d'IvoireCroatiaCubaCyprusCzech RepublicDenmarkDjiboutiDominicaDominican RepublicEarly-demographic dividendEast Asia & PacificEast Asia & Pacific (excluding high income)East Asia & Pacific (IDA & IBRD countries)EcuadorEgypt, Arab Rep.El SalvadorEquatorial GuineaEritreaEstoniaEthiopiaEuro areaEurope & Central AsiaEurope & Central Asia (excluding high income)Europe & Central Asia (IDA & IBRD countries)European UnionFijiFinlandFragile and conflict affected situationsFranceGabonGambia, TheGeorgiaGermanyGhanaGreeceGrenadaGuatemalaGuineaGuinea-BissauGuyanaHeavily indebted poor countries (HIPC)High incomeHondurasHong Kong SAR, ChinaHungaryIBRD onlyIcelandIDA & IBRD totalIDA blendIDA onlyIDA totalIndiaIndonesiaIran, Islamic Rep.IraqIrelandIsraelItalyJamaicaJapanJordanKazakhstanKenyaKorea, Dem. People’s Rep.Korea, Rep.KuwaitKyrgyz RepublicLao PDRLate-demographic dividendLatin America & Caribbean Latin America & Caribbean (excluding high income)Latin America & the Caribbean (IDA & IBRD countries)LatviaLeast developed countries: UN classificationLebanonLesothoLiberiaLibyaLiechtensteinLithuaniaLow & middle incomeLow incomeLower middle incomeLuxembourgMacao SAR, ChinaMacedonia, FYRMadagascarMaldivesMaliMaltaMarshall IslandsMauritaniaMauritiusMexicoMicronesia, Fed. Sts.Middle East & North AfricaMiddle East & North Africa (excluding high income)Middle East & North Africa (IDA & IBRD countries)Middle incomeMoldovaMongoliaMontenegroMoroccoMozambiqueMyanmarNamibiaNauruNepalNetherlandsNew ZealandNicaraguaNigerNigeriaNorth AmericaNorwayOECD membersOmanOther small statesPacific island small statesPakistanPalauPanamaPapua New GuineaParaguayPeruPhilippinesPolandPortugalPost-demographic dividendPre-demographic dividendPuerto RicoQatarRomaniaRussian FederationRwandaSamoaSan MarinoSao Tome and PrincipeSaudi ArabiaSenegalSerbiaSeychellesSierra LeoneSlovak RepublicSloveniaSmall statesSolomon IslandsSomaliaSouth AfricaSouth AsiaSouth Asia (IDA & IBRD)South SudanSpainSri LankaSt. Kitts and NevisSt. LuciaSt. Vincent and the GrenadinesSub-Saharan Africa Sub-Saharan Africa (excluding high income)Sub-Saharan Africa (IDA & IBRD countries)SudanSurinameSwazilandSwedenSwitzerlandSyrian Arab RepublicTajikistanTanzaniaThailandTimor-LesteTogoTongaTrinidad and TobagoTunisiaTurkeyTurkmenistanTuvaluUgandaUkraineUnited Arab EmiratesUnited KingdomUnited StatesUpper middle incomeUruguayUzbekistanVanuatuVenezuela, RBVietnamWest Bank and GazaWorldYemen, Rep.Zimbabwe línea de tiempo (timeline):
En esta escala de tiempo se presenta un gráfico de 1972 y 2015 de Hungary. Los datos de 1971 están ausentes. El número de observaciones reales por fecha: 43.
Fuente (nombre):
Indicadores del desarrollo mundial
Fuente (organización):
UNESCO Institute for Statistics
Categorías:
Education, Gender
Se ha actualizado:
23 abr 2017 año
Los indicadores de los cambios de valor en los últimos años
Mínimo:
46.439
1 ene 1972 año
Máximo:
89.106
1 ene 1992 año
A la fecha de observación
Valor
Cambio absoluto
El cambio con respecto al valor anterior
1 ene 1972 año
46.439
+46.439
0.0%
1 ene 1973 año
48.113
+1.674
3.6%
1 ene 1974 año
49.211
+1.099
2.28%
1 ene 1975 año
51.004
+1.792
3.64%
1 ene 1976 año
52.666
+1.662
3.26%
1 ene 1977 año
54.187
+1.522
2.89%
1 ene 1978 año
57.04
+2.852
5.26%
1 ene 1979 año
62.469
+5.429
9.52%
1 ene 1980 año
67.657
+5.188
8.31%
1 ene 1981 año
71.881
+4.224
6.24%
1 ene 1982 año
73.426
+1.545
2.15%
1 ene 1983 año
71.064
-2.362
-3.22%
1 ene 1984 año
67.451
-3.613
-5.08%
1 ene 1985 año
64.59
-2.862
-4.24%
1 ene 1986 año
64.279
-0.311
-0.48%
1 ene 1987 año
64.407
+0.128
0.2%
1 ene 1988 año
67.235
+2.828
4.39%
1 ene 1989 año
74.019
+6.785
10.09%
1 ene 1990 año
83.084
+9.065
12.25%
1 ene 1991 año
85.892
+2.808
3.38%
1 ene 1992 año
89.106
+3.214
3.74%
1 ene 1993 año
87.891
-1.215
-1.36%
1 ene 1995 año
80.51
-7.381
-8.4%
1 ene 1996 año
80.769
+0.259
0.32%
1 ene 1997 año
81.196
+0.427
0.53%
1 ene 1998 año
80.734
-0.462
-0.57%
1 ene 1999 año
80.15
-0.584
-0.72%
1 ene 2000 año
80.36
+0.21
0.26%
1 ene 2001 año
80.233
-0.127
-0.16%
1 ene 2002 año
79.649
-0.585
-0.73%
1 ene 2003 año
80.777
+1.128
1.42%
1 ene 2004 año
82.558
+1.781
2.2%
1 ene 2005 año
85.577
+3.019
3.66%
1 ene 2006 año
87.138
+1.561
1.82%
1 ene 2007 año
88.705
+1.567
1.8%
1 ene 2008 año
88.896
+0.191
0.22%
1 ene 2009 año
86.698
-2.198
-2.47%
1 ene 2010 año
85.512
-1.187
-1.37%
1 ene 2011 año
85.851
+0.339
0.4%
1 ene 2012 año
87.629
+1.778
2.07%
1 ene 2013 año
87.915
+0.286
0.33%
1 ene 2014 año
87.243
-0.672
-0.76%
1 ene 2015 año
84.696
-2.547
-2.92%
Ranking de los países por los datos estadísticos actuales


Comentarios: