29
/es/
es
AIzaSyAYiBZKx7MnpbEhh9jyipgxe19OcubqV5w
April 1, 2024
150429
Honduras
HND
true
2
1
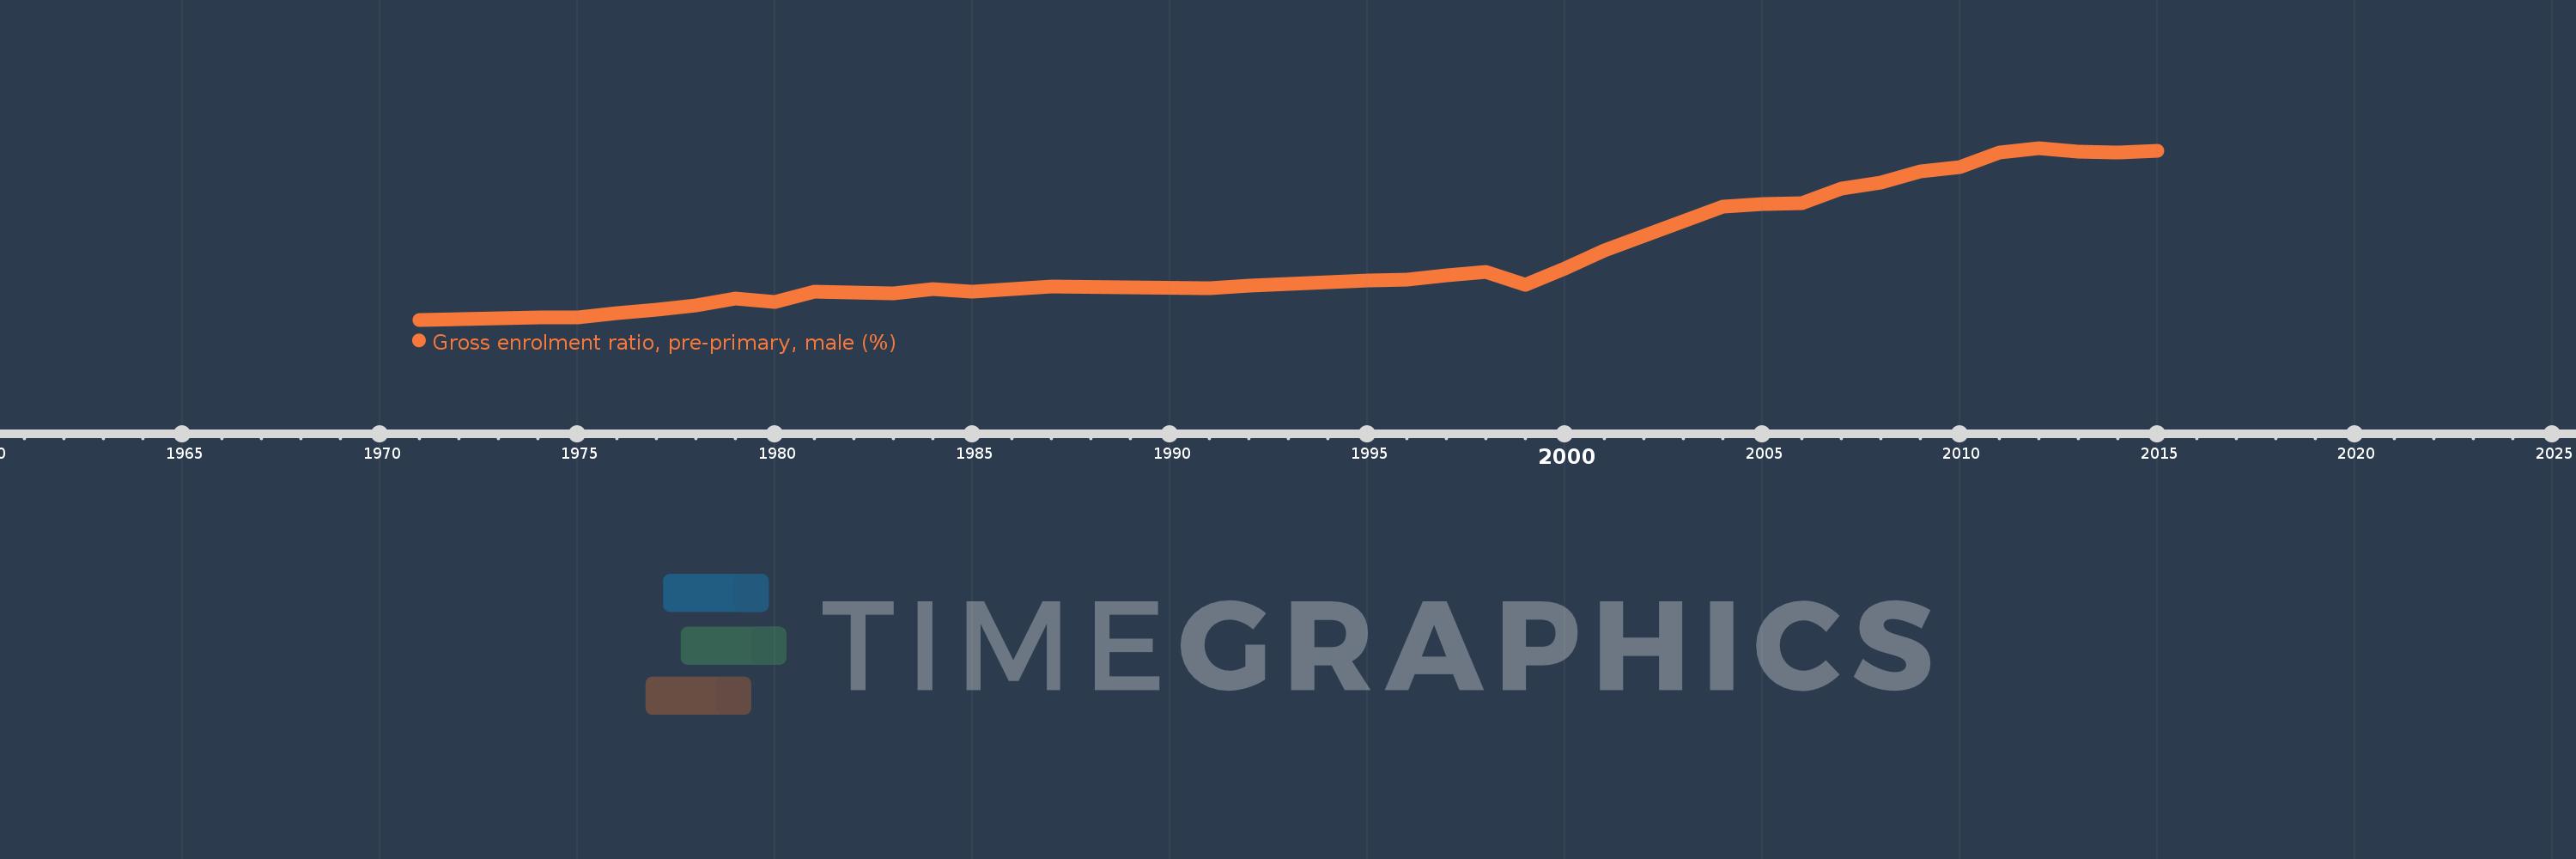
Gross enrolment ratio, pre-primary, male (%)
2015,2014,2013,2012,2011,2010,2009,2008,2007,2006,2005,2004,2001,2000,1999,1998,1997,1996,1995,1994,1993,1992,1991,1987,1985,1984,1983,1982,1981,1980,1979,1978,1977,1976,1975,1974,1973,1972,1971
Estas estadísticas en otros países:
AfghanistanAlbaniaAlgeriaAndorraAngolaAntigua and BarbudaArab WorldArgentinaArmeniaArubaAustraliaAustriaAzerbaijanBahamas, TheBahrainBangladeshBarbadosBelarusBelgiumBelizeBeninBermudaBhutanBoliviaBosnia and HerzegovinaBotswanaBrazilBrunei DarussalamBulgariaBurkina FasoBurundiCabo VerdeCambodiaCameroonCanadaCaribbean small statesCentral African RepublicCentral Europe and the BalticsChadChileChinaColombiaComorosCongo, Dem. Rep.Congo, Rep.Costa RicaCote d'IvoireCroatiaCubaCyprusCzech RepublicDenmarkDjiboutiDominicaDominican RepublicEarly-demographic dividendEast Asia & PacificEast Asia & Pacific (excluding high income)East Asia & Pacific (IDA & IBRD countries)EcuadorEgypt, Arab Rep.El SalvadorEquatorial GuineaEritreaEstoniaEthiopiaEuro areaEurope & Central AsiaEurope & Central Asia (excluding high income)Europe & Central Asia (IDA & IBRD countries)European UnionFijiFinlandFragile and conflict affected situationsFranceGabonGambia, TheGeorgiaGermanyGhanaGreeceGrenadaGuatemalaGuineaGuinea-BissauGuyanaHeavily indebted poor countries (HIPC)High incomeHondurasHong Kong SAR, ChinaHungaryIBRD onlyIcelandIDA & IBRD totalIDA blendIDA onlyIDA totalIndiaIndonesiaIran, Islamic Rep.IraqIrelandIsraelItalyJamaicaJapanJordanKazakhstanKenyaKorea, Dem. People’s Rep.Korea, Rep.KuwaitKyrgyz RepublicLao PDRLate-demographic dividendLatin America & Caribbean Latin America & Caribbean (excluding high income)Latin America & the Caribbean (IDA & IBRD countries)LatviaLeast developed countries: UN classificationLebanonLesothoLiberiaLibyaLiechtensteinLithuaniaLow & middle incomeLow incomeLower middle incomeLuxembourgMacao SAR, ChinaMacedonia, FYRMadagascarMaldivesMaliMaltaMarshall IslandsMauritaniaMauritiusMexicoMicronesia, Fed. Sts.Middle East & North AfricaMiddle East & North Africa (excluding high income)Middle East & North Africa (IDA & IBRD countries)Middle incomeMoldovaMongoliaMontenegroMoroccoMozambiqueMyanmarNamibiaNauruNepalNetherlandsNew ZealandNicaraguaNigerNigeriaNorth AmericaNorwayOECD membersOmanOther small statesPacific island small statesPakistanPalauPanamaPapua New GuineaParaguayPeruPhilippinesPolandPortugalPost-demographic dividendPre-demographic dividendPuerto RicoQatarRomaniaRussian FederationRwandaSamoaSan MarinoSao Tome and PrincipeSaudi ArabiaSenegalSerbiaSeychellesSierra LeoneSlovak RepublicSloveniaSmall statesSolomon IslandsSomaliaSouth AfricaSouth AsiaSouth Asia (IDA & IBRD)South SudanSpainSri LankaSt. Kitts and NevisSt. LuciaSt. Vincent and the GrenadinesSub-Saharan Africa Sub-Saharan Africa (excluding high income)Sub-Saharan Africa (IDA & IBRD countries)SudanSurinameSwazilandSwedenSwitzerlandSyrian Arab RepublicTajikistanTanzaniaThailandTimor-LesteTogoTongaTrinidad and TobagoTunisiaTurkeyTurkmenistanTuvaluUgandaUkraineUnited Arab EmiratesUnited KingdomUnited StatesUpper middle incomeUruguayUzbekistanVanuatuVenezuela, RBVietnamWest Bank and GazaWorldYemen, Rep.Zimbabwe línea de tiempo (timeline):
En esta escala de tiempo se presenta un gráfico de 1971 y 2015 de Honduras. Los datos de 1970 están ausentes. El número de observaciones reales por fecha: 39.
Fuente (nombre):
Indicadores del desarrollo mundial
Fuente (organización):
UNESCO Institute for Statistics
Categorías:
Education, Gender
Se ha actualizado:
23 abr 2017 año
Los indicadores de los cambios de valor en los últimos años
Mínimo:
3.441
1 ene 1971 año
Máximo:
47.373
1 ene 2012 año
A la fecha de observación
Valor
Cambio absoluto
El cambio con respecto al valor anterior
1 ene 1971 año
3.441
+3.441
0.0%
1 ene 1972 año
3.489
+0.048
1.41%
1 ene 1973 año
3.831
+0.341
9.78%
1 ene 1974 año
4.068
+0.237
6.2%
1 ene 1975 año
4.12
+0.052
1.28%
1 ene 1976 año
5.054
+0.934
22.67%
1 ene 1977 año
5.925
+0.87
17.22%
1 ene 1978 año
7.121
+1.196
20.19%
1 ene 1979 año
8.796
+1.675
23.52%
1 ene 1980 año
7.991
-0.805
-9.15%
1 ene 1981 año
10.68
+2.689
33.65%
1 ene 1982 año
10.477
-0.203
-1.9%
1 ene 1983 año
10.177
-0.3
-2.87%
1 ene 1984 año
11.33
+1.153
11.33%
1 ene 1985 año
10.666
-0.664
-5.86%
1 ene 1987 año
11.937
+1.271
11.91%
1 ene 1991 año
11.6
-0.336
-2.82%
1 ene 1992 año
12.13
+0.529
4.56%
1 ene 1993 año
12.62
+0.49
4.04%
1 ene 1994 año
12.949
+0.329
2.61%
1 ene 1995 año
13.397
+0.448
3.46%
1 ene 1996 año
13.701
+0.304
2.27%
1 ene 1997 año
14.901
+1.2
8.76%
1 ene 1998 año
15.654
+0.753
5.06%
1 ene 1999 año
12.421
-3.233
-20.66%
1 ene 2000 año
16.53
+4.109
33.08%
1 ene 2001 año
21.071
+4.542
27.48%
1 ene 2004 año
32.426
+11.355
53.89%
1 ene 2005 año
32.994
+0.568
1.75%
1 ene 2006 año
33.233
+0.239
0.72%
1 ene 2007 año
37.054
+3.821
11.5%
1 ene 2008 año
38.421
+1.367
3.69%
1 ene 2009 año
41.457
+3.036
7.9%
1 ene 2010 año
42.51
+1.053
2.54%
1 ene 2011 año
46.138
+3.628
8.53%
1 ene 2012 año
47.373
+1.235
2.68%
1 ene 2013 año
46.488
-0.886
-1.87%
1 ene 2014 año
46.118
-0.369
-0.79%
1 ene 2015 año
46.581
+0.463
1.0%
Ranking de los países por los datos estadísticos actuales


Comentarios: