29
/es/
es
AIzaSyAYiBZKx7MnpbEhh9jyipgxe19OcubqV5w
April 1, 2024
41492
Latin America & Caribbean
LCN
false
2
1
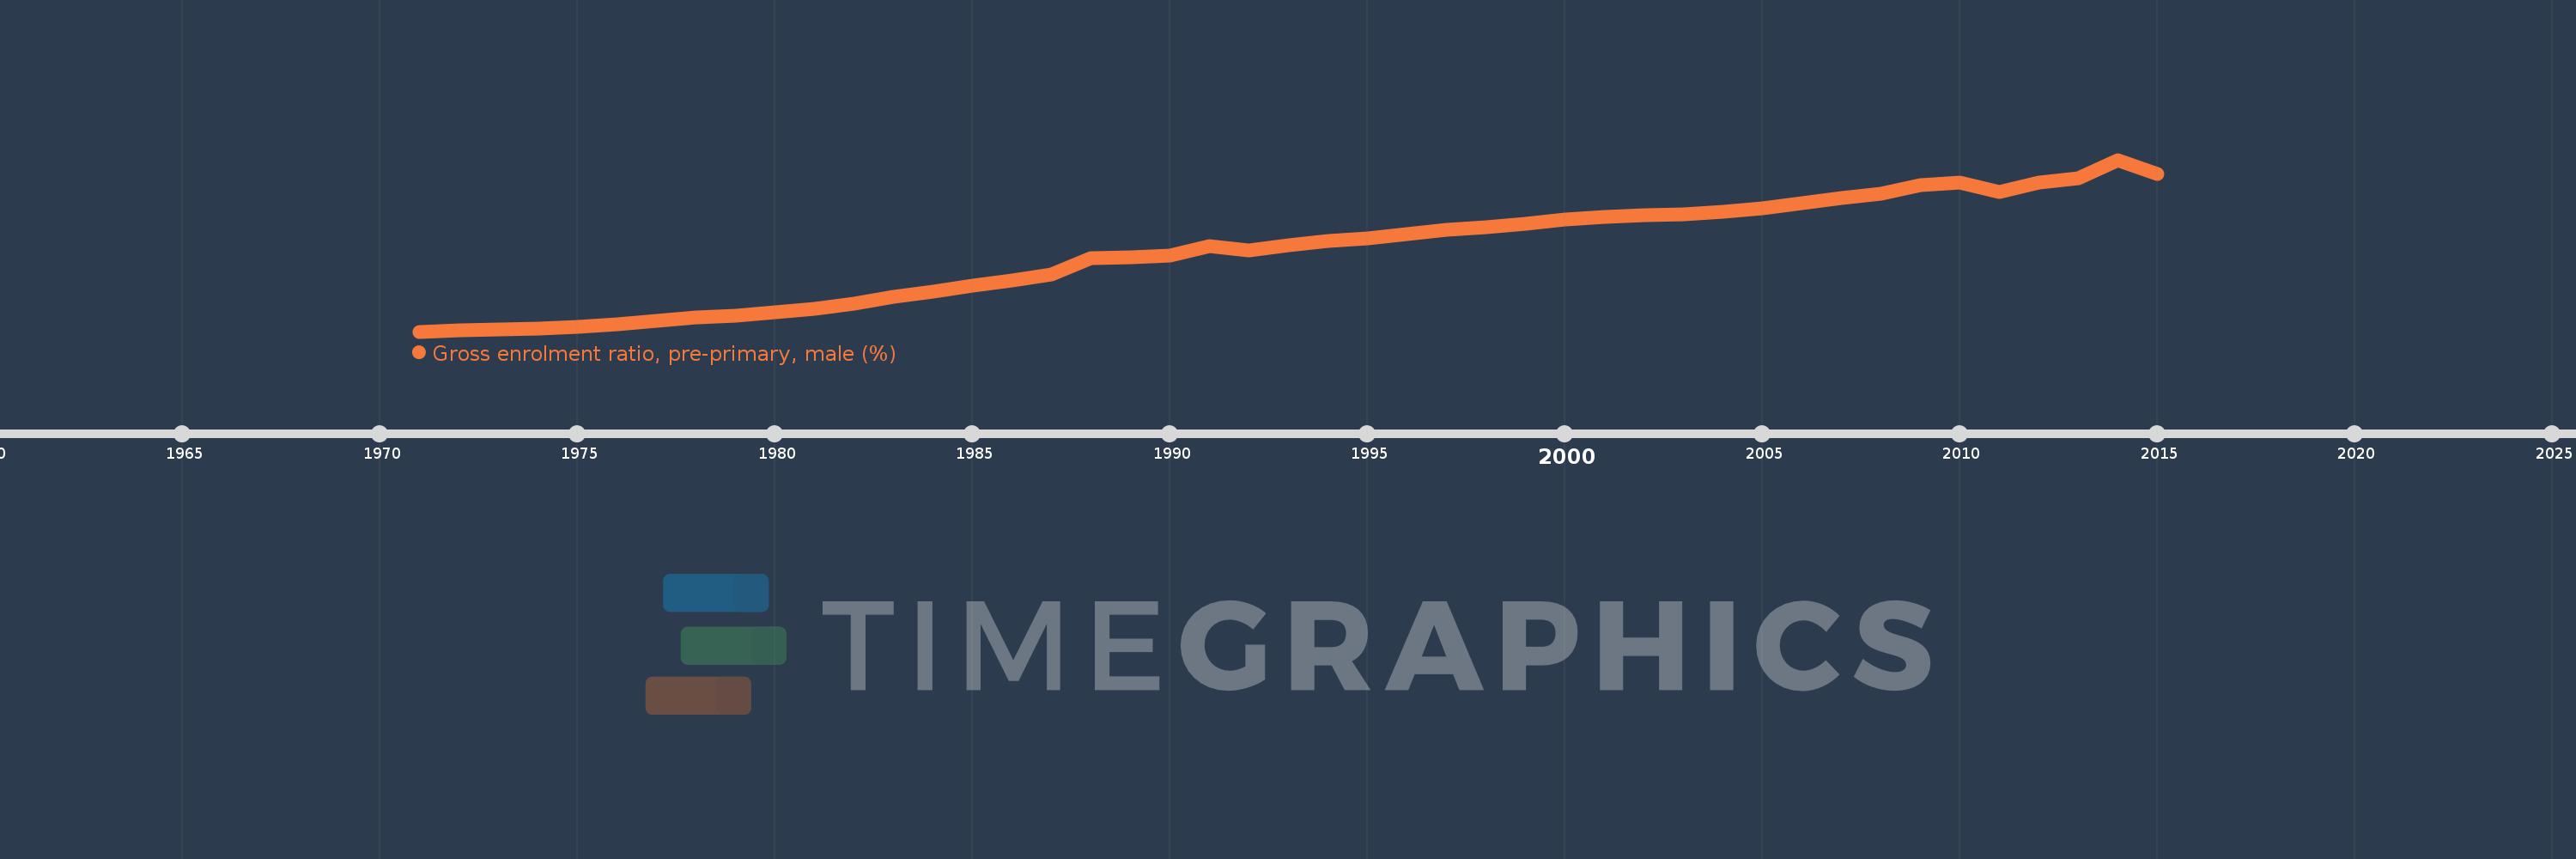
Gross enrolment ratio, pre-primary, male (%)
2015,2014,2013,2012,2011,2010,2009,2008,2007,2006,2005,2004,2003,2002,2001,2000,1999,1998,1997,1996,1995,1994,1993,1992,1991,1990,1989,1988,1987,1986,1985,1984,1983,1982,1981,1980,1979,1978,1977,1976,1975,1974,1973,1972,1971
Estas estadísticas en otros países:
AfghanistanAlbaniaAlgeriaAndorraAngolaAntigua and BarbudaArab WorldArgentinaArmeniaArubaAustraliaAustriaAzerbaijanBahamas, TheBahrainBangladeshBarbadosBelarusBelgiumBelizeBeninBermudaBhutanBoliviaBosnia and HerzegovinaBotswanaBrazilBrunei DarussalamBulgariaBurkina FasoBurundiCabo VerdeCambodiaCameroonCanadaCaribbean small statesCentral African RepublicCentral Europe and the BalticsChadChileChinaColombiaComorosCongo, Dem. Rep.Congo, Rep.Costa RicaCote d'IvoireCroatiaCubaCyprusCzech RepublicDenmarkDjiboutiDominicaDominican RepublicEarly-demographic dividendEast Asia & PacificEast Asia & Pacific (excluding high income)East Asia & Pacific (IDA & IBRD countries)EcuadorEgypt, Arab Rep.El SalvadorEquatorial GuineaEritreaEstoniaEthiopiaEuro areaEurope & Central AsiaEurope & Central Asia (excluding high income)Europe & Central Asia (IDA & IBRD countries)European UnionFijiFinlandFragile and conflict affected situationsFranceGabonGambia, TheGeorgiaGermanyGhanaGreeceGrenadaGuatemalaGuineaGuinea-BissauGuyanaHeavily indebted poor countries (HIPC)High incomeHondurasHong Kong SAR, ChinaHungaryIBRD onlyIcelandIDA & IBRD totalIDA blendIDA onlyIDA totalIndiaIndonesiaIran, Islamic Rep.IraqIrelandIsraelItalyJamaicaJapanJordanKazakhstanKenyaKorea, Dem. People’s Rep.Korea, Rep.KuwaitKyrgyz RepublicLao PDRLate-demographic dividendLatin America & Caribbean Latin America & Caribbean (excluding high income)Latin America & the Caribbean (IDA & IBRD countries)LatviaLeast developed countries: UN classificationLebanonLesothoLiberiaLibyaLiechtensteinLithuaniaLow & middle incomeLow incomeLower middle incomeLuxembourgMacao SAR, ChinaMacedonia, FYRMadagascarMaldivesMaliMaltaMarshall IslandsMauritaniaMauritiusMexicoMicronesia, Fed. Sts.Middle East & North AfricaMiddle East & North Africa (excluding high income)Middle East & North Africa (IDA & IBRD countries)Middle incomeMoldovaMongoliaMontenegroMoroccoMozambiqueMyanmarNamibiaNauruNepalNetherlandsNew ZealandNicaraguaNigerNigeriaNorth AmericaNorwayOECD membersOmanOther small statesPacific island small statesPakistanPalauPanamaPapua New GuineaParaguayPeruPhilippinesPolandPortugalPost-demographic dividendPre-demographic dividendPuerto RicoQatarRomaniaRussian FederationRwandaSamoaSan MarinoSao Tome and PrincipeSaudi ArabiaSenegalSerbiaSeychellesSierra LeoneSlovak RepublicSloveniaSmall statesSolomon IslandsSomaliaSouth AfricaSouth AsiaSouth Asia (IDA & IBRD)South SudanSpainSri LankaSt. Kitts and NevisSt. LuciaSt. Vincent and the GrenadinesSub-Saharan Africa Sub-Saharan Africa (excluding high income)Sub-Saharan Africa (IDA & IBRD countries)SudanSurinameSwazilandSwedenSwitzerlandSyrian Arab RepublicTajikistanTanzaniaThailandTimor-LesteTogoTongaTrinidad and TobagoTunisiaTurkeyTurkmenistanTuvaluUgandaUkraineUnited Arab EmiratesUnited KingdomUnited StatesUpper middle incomeUruguayUzbekistanVanuatuVenezuela, RBVietnamWest Bank and GazaWorldYemen, Rep.Zimbabwe línea de tiempo (timeline):
En esta escala de tiempo se presenta un gráfico de 1971 y 2015 de Latin America & Caribbean . Los datos de 1970 están ausentes. El número de observaciones reales por fecha: 45.
Fuente (nombre):
Indicadores del desarrollo mundial
Fuente (organización):
UNESCO Institute for Statistics
Categorías:
Education, Gender
Se ha actualizado:
23 abr 2017 año
Los indicadores de los cambios de valor en los últimos años
Mínimo:
8.258
1 ene 1971 año
Máximo:
78.513
1 ene 2014 año
A la fecha de observación
Valor
Cambio absoluto
El cambio con respecto al valor anterior
1 ene 1971 año
8.258
+8.258
0.0%
1 ene 1972 año
8.621
+0.363
4.39%
1 ene 1973 año
9.087
+0.467
5.41%
1 ene 1974 año
9.566
+0.479
5.27%
1 ene 1975 año
10.151
+0.585
6.12%
1 ene 1976 año
11.229
+1.077
10.61%
1 ene 1977 año
12.673
+1.445
12.86%
1 ene 1978 año
13.913
+1.24
9.78%
1 ene 1979 año
14.895
+0.982
7.05%
1 ene 1980 año
16.319
+1.424
9.56%
1 ene 1981 año
17.432
+1.113
6.82%
1 ene 1982 año
19.644
+2.212
12.69%
1 ene 1983 año
22.39
+2.747
13.98%
1 ene 1984 año
24.577
+2.187
9.77%
1 ene 1985 año
27.182
+2.605
10.6%
1 ene 1986 año
29.0
+1.818
6.69%
1 ene 1987 año
31.445
+2.445
8.43%
1 ene 1988 año
38.279
+6.834
21.73%
1 ene 1989 año
38.769
+0.49
1.28%
1 ene 1990 año
39.233
+0.465
1.2%
1 ene 1991 año
43.161
+3.928
10.01%
1 ene 1992 año
41.327
-1.834
-4.25%
1 ene 1993 año
43.571
+2.243
5.43%
1 ene 1994 año
45.414
+1.843
4.23%
1 ene 1995 año
46.342
+0.928
2.04%
1 ene 1996 año
48.243
+1.902
4.1%
1 ene 1997 año
49.868
+1.625
3.37%
1 ene 1998 año
50.897
+1.03
2.06%
1 ene 1999 año
52.265
+1.368
2.69%
1 ene 2000 año
53.933
+1.667
3.19%
1 ene 2001 año
55.088
+1.155
2.14%
1 ene 2002 año
55.911
+0.823
1.49%
1 ene 2003 año
56.298
+0.387
0.69%
1 ene 2004 año
57.433
+1.135
2.02%
1 ene 2005 año
58.599
+1.166
2.03%
1 ene 2006 año
60.691
+2.092
3.57%
1 ene 2007 año
62.919
+2.228
3.67%
1 ene 2008 año
64.544
+1.625
2.58%
1 ene 2009 año
68.238
+3.694
5.72%
1 ene 2010 año
69.198
+0.96
1.41%
1 ene 2011 año
65.246
-3.952
-5.71%
1 ene 2012 año
69.144
+3.898
5.97%
1 ene 2013 año
70.882
+1.738
2.51%
1 ene 2014 año
78.513
+7.631
10.77%
1 ene 2015 año
72.575
-5.937
-7.56%
Ranking de los países por los datos estadísticos actuales


Comentarios: