29
/es/
es
AIzaSyAYiBZKx7MnpbEhh9jyipgxe19OcubqV5w
April 1, 2024
83164
Belize
BLZ
true
2
1
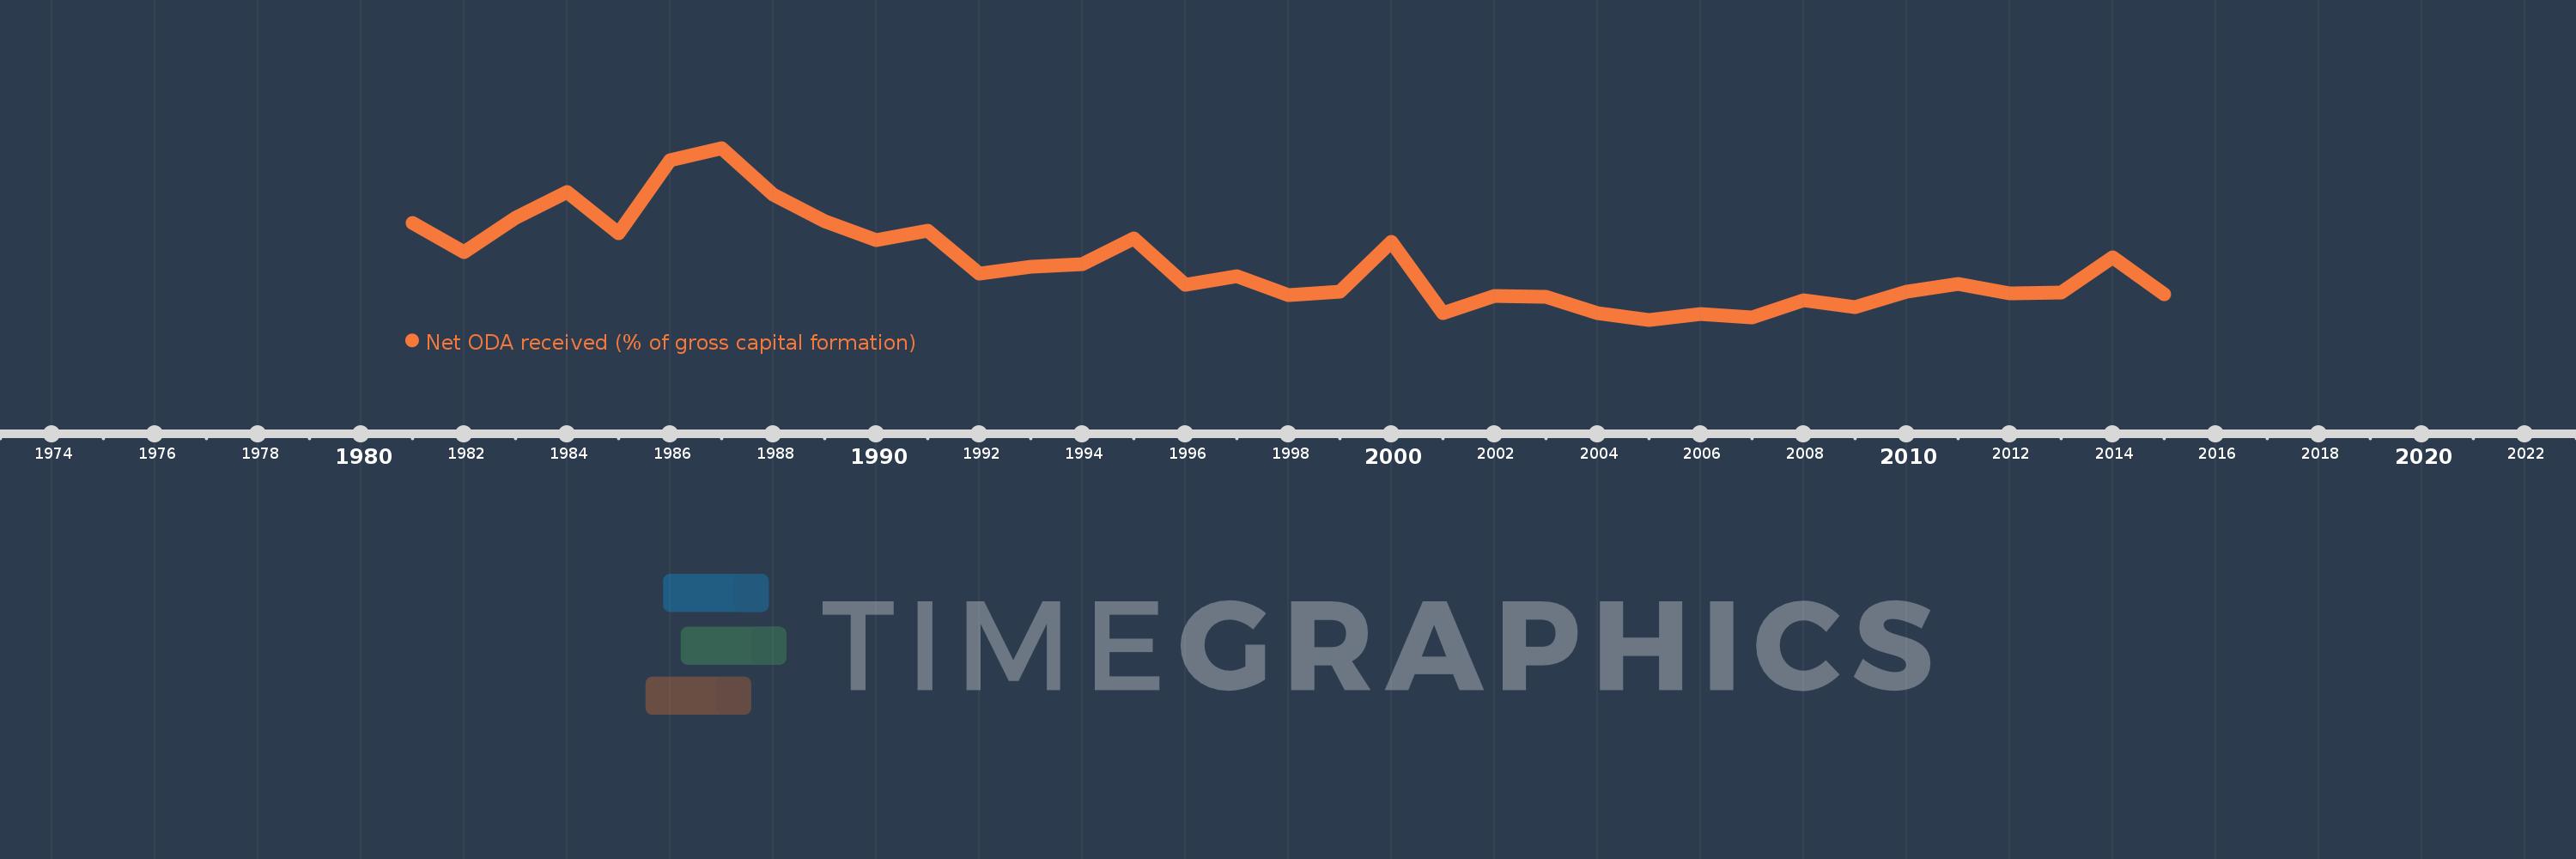
Net ODA received (% of gross capital formation)
2015,2014,2013,2012,2011,2010,2009,2008,2007,2006,2005,2004,2003,2002,2001,2000,1999,1998,1997,1996,1995,1994,1993,1992,1991,1990,1989,1988,1987,1986,1985,1984,1983,1982,1981
Estas estadísticas en otros países:
AfghanistanAlbaniaAlgeriaAngolaAntigua and BarbudaArab WorldArgentinaArmeniaArubaAzerbaijanBahamas, TheBahrainBangladeshBarbadosBelarusBelizeBeninBhutanBoliviaBosnia and HerzegovinaBotswanaBrazilBrunei DarussalamBurkina FasoBurundiCabo VerdeCambodiaCameroonCaribbean small statesCentral African RepublicCentral Europe and the BalticsChadChileChinaColombiaComorosCongo, Dem. Rep.Congo, Rep.Costa RicaCote d'IvoireCroatiaCubaCyprusDjiboutiDominicaDominican RepublicEast Asia & PacificEast Asia & Pacific (excluding high income)East Asia & Pacific (IDA & IBRD countries)EcuadorEgypt, Arab Rep.El SalvadorEquatorial GuineaEritreaEthiopiaEuro areaEurope & Central AsiaEurope & Central Asia (excluding high income)Europe & Central Asia (IDA & IBRD countries)European UnionFijiFragile and conflict affected situationsGabonGambia, TheGeorgiaGhanaGrenadaGuatemalaGuineaGuinea-BissauGuyanaHaitiHeavily indebted poor countries (HIPC)High incomeHondurasHong Kong SAR, ChinaIBRD onlyIDA & IBRD totalIDA blendIDA onlyIDA totalIndiaIndonesiaIran, Islamic Rep.IraqIsraelJamaicaJordanKazakhstanKenyaKiribatiKorea, Rep.KosovoKuwaitKyrgyz RepublicLao PDRLatin America & Caribbean Latin America & Caribbean (excluding high income)Latin America & the Caribbean (IDA & IBRD countries)Least developed countries: UN classificationLebanonLesothoLiberiaLibyaLow & middle incomeLow incomeLower middle incomeMacao SAR, ChinaMacedonia, FYRMadagascarMalawiMalaysiaMaldivesMaliMaltaMauritaniaMauritiusMexicoMiddle East & North AfricaMiddle East & North Africa (excluding high income)Middle East & North Africa (IDA & IBRD countries)Middle incomeMoldovaMongoliaMontenegroMoroccoMozambiqueNamibiaNepalNew CaledoniaNicaraguaNigerNigeriaNorth AmericaOECD membersOmanOther small statesPakistanPanamaPapua New GuineaParaguayPeruPhilippinesQatarRwandaSaudi ArabiaSenegalSerbiaSeychellesSierra LeoneSingaporeSloveniaSmall statesSolomon IslandsSouth AfricaSouth AsiaSouth Asia (IDA & IBRD)South SudanSri LankaSt. Kitts and NevisSt. LuciaSt. Vincent and the GrenadinesSub-Saharan Africa Sub-Saharan Africa (excluding high income)Sub-Saharan Africa (IDA & IBRD countries)SudanSurinameSwazilandSyrian Arab RepublicTajikistanTanzaniaThailandTimor-LesteTogoTongaTrinidad and TobagoTunisiaTurkeyTurkmenistanUgandaUkraineUpper middle incomeUruguayUzbekistanVanuatuVenezuela, RBVietnamWest Bank and GazaWorldYemen, Rep.ZambiaZimbabwe línea de tiempo (timeline):
En esta escala de tiempo se presenta un gráfico de 1981 y 2015 de Belize. Los datos de 1980 están ausentes. El número de observaciones reales por fecha: 35.
Fuente (nombre):
Indicadores del desarrollo mundial
Fuente (organización):
Development Assistance Committee of the Organisation for Economic Co-operation and Development, Geographical Distribution of Financial Flows to Developing Countries, Development Co-operation Report, and International Development Statistics database. Data are available online at: www.oecd.org/dac/stats/idsonline. World Bank gross capital formation estimates are used for the denominator.
Categorías:
Aid Effectiveness
Se ha actualizado:
23 abr 2017 año
Los indicadores de los cambios de valor en los últimos años
Mínimo:
3.665
1 ene 2005 año
Máximo:
51.853
1 ene 1987 año
A la fecha de observación
Valor
Cambio absoluto
El cambio con respecto al valor anterior
1 ene 1981 año
30.884
+30.884
0.0%
1 ene 1982 año
22.507
-8.376
-27.12%
1 ene 1983 año
32.339
+9.831
43.68%
1 ene 1984 año
39.424
+7.085
21.91%
1 ene 1985 año
27.996
-11.428
-28.99%
1 ene 1986 año
48.518
+20.522
73.3%
1 ene 1987 año
51.853
+3.336
6.88%
1 ene 1988 año
38.714
-13.14
-25.34%
1 ene 1989 año
31.302
-7.412
-19.15%
1 ene 1990 año
25.927
-5.374
-17.17%
1 ene 1991 año
28.617
+2.69
10.38%
1 ene 1992 año
16.555
-12.062
-42.15%
1 ene 1993 año
18.522
+1.967
11.88%
1 ene 1994 año
19.135
+0.613
3.31%
1 ene 1995 año
26.445
+7.311
38.21%
1 ene 1996 año
13.542
-12.903
-48.79%
1 ene 1997 año
15.804
+2.262
16.7%
1 ene 1998 año
10.653
-5.151
-32.59%
1 ene 1999 año
11.561
+0.908
8.52%
1 ene 2000 año
25.567
+14.006
121.15%
1 ene 2001 año
5.556
-20.011
-78.27%
1 ene 2002 año
10.259
+4.702
84.63%
1 ene 2003 año
10.07
-0.189
-1.84%
1 ene 2004 año
5.475
-4.595
-45.63%
1 ene 2005 año
3.665
-1.809
-33.05%
1 ene 2006 año
5.255
+1.59
43.37%
1 ene 2007 año
4.254
-1.001
-19.04%
1 ene 2008 año
9.147
+4.892
114.99%
1 ene 2009 año
7.116
-2.03
-22.2%
1 ene 2010 año
11.555
+4.438
62.37%
1 ene 2011 año
13.609
+2.055
17.78%
1 ene 2012 año
11.099
-2.511
-18.45%
1 ene 2013 año
11.413
+0.314
2.83%
1 ene 2014 año
21.179
+9.767
85.58%
1 ene 2015 año
10.937
-10.242
-48.36%
Ranking de los países por los datos estadísticos actuales


Comentarios: