29
/es/
es
AIzaSyAYiBZKx7MnpbEhh9jyipgxe19OcubqV5w
April 1, 2024
188181
Malaysia
MYS
true
2
1
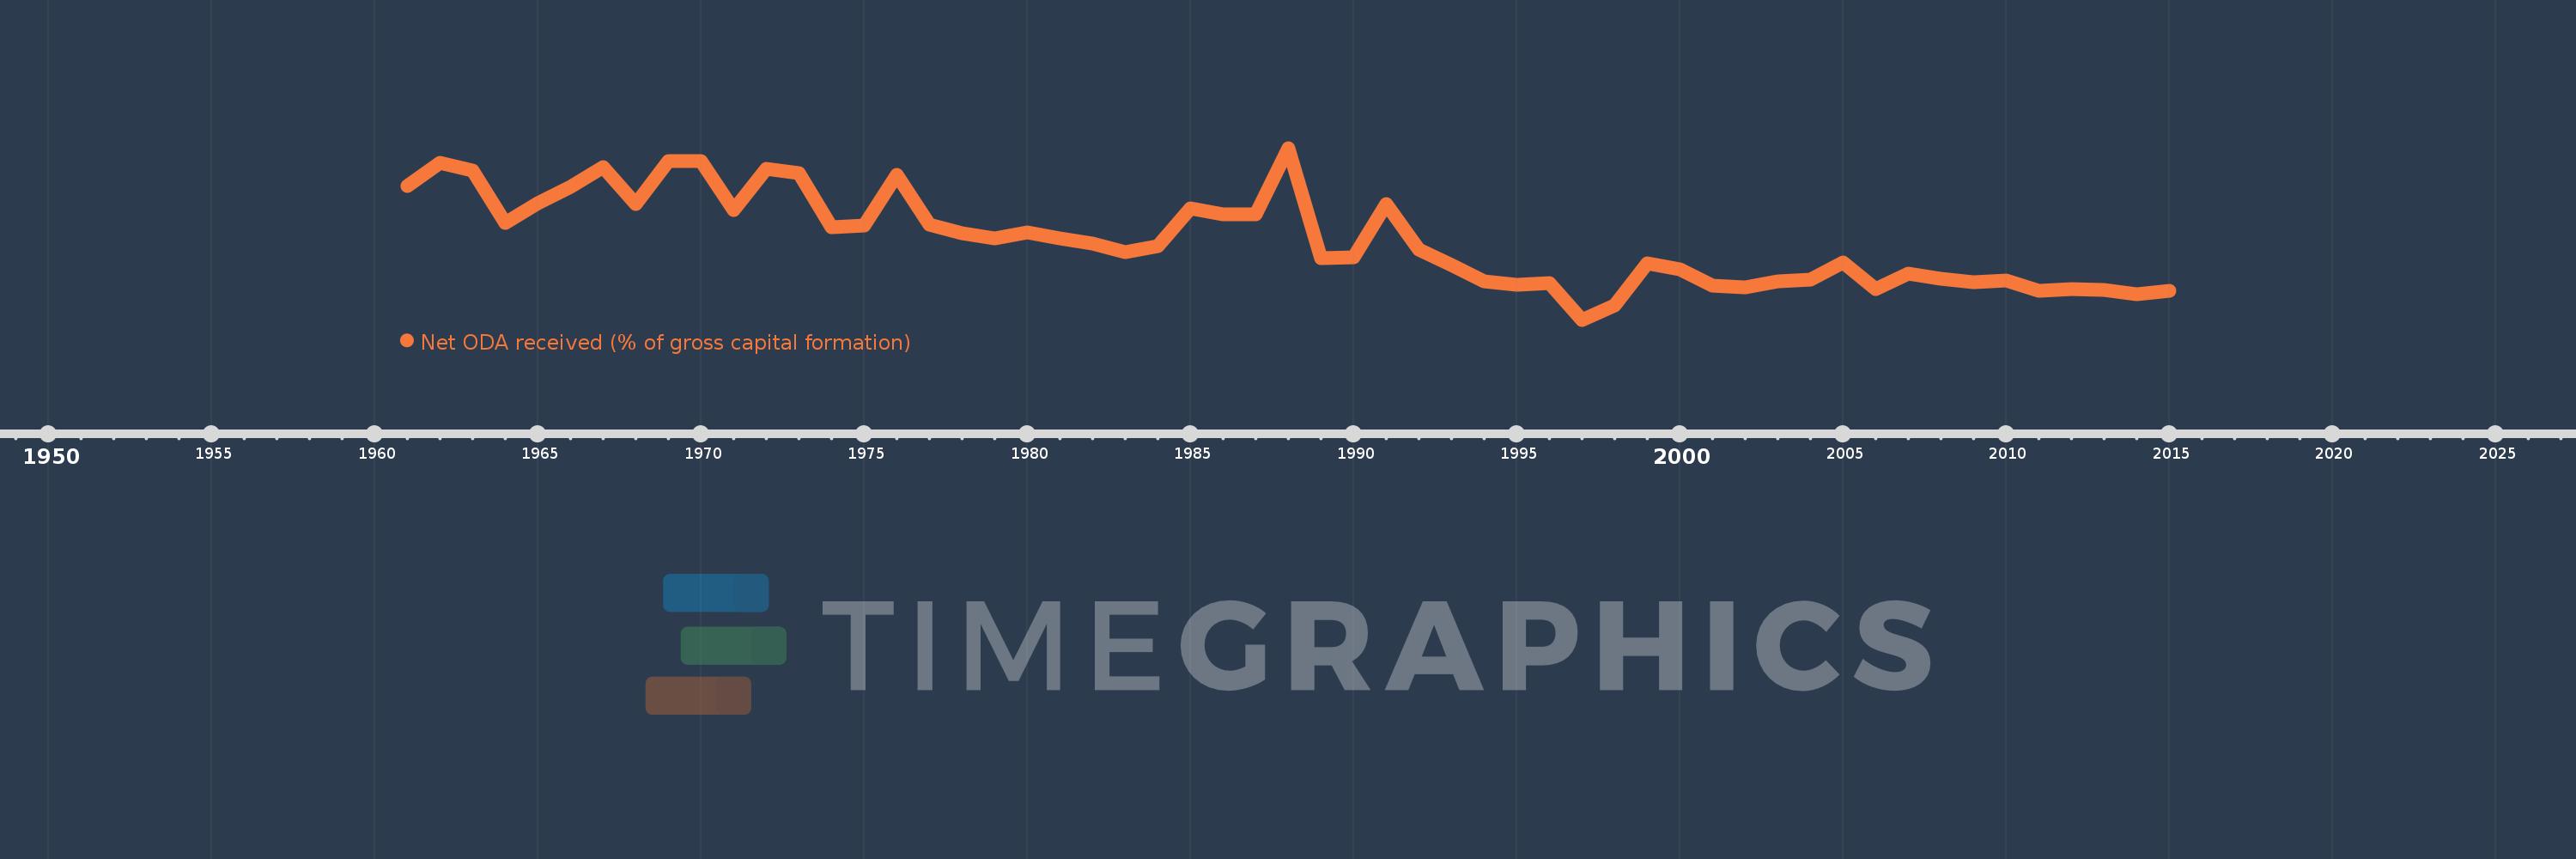
Net ODA received (% of gross capital formation)
2015,2014,2013,2012,2011,2010,2009,2008,2007,2006,2005,2004,2003,2002,2001,2000,1999,1998,1997,1996,1995,1994,1993,1992,1991,1990,1989,1988,1987,1986,1985,1984,1983,1982,1981,1980,1979,1978,1977,1976,1975,1974,1973,1972,1971,1970,1969,1968,1967,1966,1965,1964,1963,1962,1961
Estas estadísticas en otros países:
AfghanistanAlbaniaAlgeriaAngolaAntigua and BarbudaArab WorldArgentinaArmeniaArubaAzerbaijanBahamas, TheBahrainBangladeshBarbadosBelarusBelizeBeninBhutanBoliviaBosnia and HerzegovinaBotswanaBrazilBrunei DarussalamBurkina FasoBurundiCabo VerdeCambodiaCameroonCaribbean small statesCentral African RepublicCentral Europe and the BalticsChadChileChinaColombiaComorosCongo, Dem. Rep.Congo, Rep.Costa RicaCote d'IvoireCroatiaCubaCyprusDjiboutiDominicaDominican RepublicEast Asia & PacificEast Asia & Pacific (excluding high income)East Asia & Pacific (IDA & IBRD countries)EcuadorEgypt, Arab Rep.El SalvadorEquatorial GuineaEritreaEthiopiaEuro areaEurope & Central AsiaEurope & Central Asia (excluding high income)Europe & Central Asia (IDA & IBRD countries)European UnionFijiFragile and conflict affected situationsGabonGambia, TheGeorgiaGhanaGrenadaGuatemalaGuineaGuinea-BissauGuyanaHaitiHeavily indebted poor countries (HIPC)High incomeHondurasHong Kong SAR, ChinaIBRD onlyIDA & IBRD totalIDA blendIDA onlyIDA totalIndiaIndonesiaIran, Islamic Rep.IraqIsraelJamaicaJordanKazakhstanKenyaKiribatiKorea, Rep.KosovoKuwaitKyrgyz RepublicLao PDRLatin America & Caribbean Latin America & Caribbean (excluding high income)Latin America & the Caribbean (IDA & IBRD countries)Least developed countries: UN classificationLebanonLesothoLiberiaLibyaLow & middle incomeLow incomeLower middle incomeMacao SAR, ChinaMacedonia, FYRMadagascarMalawiMalaysiaMaldivesMaliMaltaMauritaniaMauritiusMexicoMiddle East & North AfricaMiddle East & North Africa (excluding high income)Middle East & North Africa (IDA & IBRD countries)Middle incomeMoldovaMongoliaMontenegroMoroccoMozambiqueNamibiaNepalNew CaledoniaNicaraguaNigerNigeriaNorth AmericaOECD membersOmanOther small statesPakistanPanamaPapua New GuineaParaguayPeruPhilippinesQatarRwandaSaudi ArabiaSenegalSerbiaSeychellesSierra LeoneSingaporeSloveniaSmall statesSolomon IslandsSouth AfricaSouth AsiaSouth Asia (IDA & IBRD)South SudanSri LankaSt. Kitts and NevisSt. LuciaSt. Vincent and the GrenadinesSub-Saharan Africa Sub-Saharan Africa (excluding high income)Sub-Saharan Africa (IDA & IBRD countries)SudanSurinameSwazilandSyrian Arab RepublicTajikistanTanzaniaThailandTimor-LesteTogoTongaTrinidad and TobagoTunisiaTurkeyTurkmenistanUgandaUkraineUpper middle incomeUruguayUzbekistanVanuatuVenezuela, RBVietnamWest Bank and GazaWorldYemen, Rep.ZambiaZimbabwe línea de tiempo (timeline):
En esta escala de tiempo se presenta un gráfico de 1961 y 2015 de Malaysia. Los datos de 1960 están ausentes. El número de observaciones reales por fecha: 55.
Fuente (nombre):
Indicadores del desarrollo mundial
Fuente (organización):
Development Assistance Committee of the Organisation for Economic Co-operation and Development, Geographical Distribution of Financial Flows to Developing Countries, Development Co-operation Report, and International Development Statistics database. Data are available online at: www.oecd.org/dac/stats/idsonline. World Bank gross capital formation estimates are used for the denominator.
Categorías:
Aid Effectiveness
Se ha actualizado:
23 abr 2017 año
Los indicadores de los cambios de valor en los últimos años
Mínimo:
-1.092
1 ene 1997 año
Máximo:
5.402
1 ene 1988 año
A la fecha de observación
Valor
Cambio absoluto
El cambio con respecto al valor anterior
1 ene 1961 año
3.951
+3.951
0.0%
1 ene 1962 año
4.844
+0.893
22.61%
1 ene 1963 año
4.561
-0.284
-5.85%
1 ene 1964 año
2.569
-1.992
-43.67%
1 ene 1965 año
3.298
+0.729
28.36%
1 ene 1966 año
3.917
+0.62
18.79%
1 ene 1967 año
4.684
+0.767
19.58%
1 ene 1968 año
3.282
-1.402
-29.93%
1 ene 1969 año
4.907
+1.625
49.51%
1 ene 1970 año
4.89
-0.017
-0.35%
1 ene 1971 año
3.053
-1.837
-37.56%
1 ene 1972 año
4.628
+1.575
51.59%
1 ene 1973 año
4.456
-0.172
-3.71%
1 ene 1974 año
2.401
-2.055
-46.12%
1 ene 1975 año
2.47
+0.069
2.87%
1 ene 1976 año
4.394
+1.924
77.89%
1 ene 1977 año
2.518
-1.876
-42.7%
1 ene 1978 año
2.179
-0.338
-13.43%
1 ene 1979 año
1.995
-0.184
-8.46%
1 ene 1980 año
2.212
+0.217
10.89%
1 ene 1981 año
1.97
-0.242
-10.95%
1 ene 1982 año
1.782
-0.188
-9.55%
1 ene 1983 año
1.47
-0.312
-17.51%
1 ene 1984 año
1.683
+0.213
14.48%
1 ene 1985 año
3.12
+1.437
85.41%
1 ene 1986 año
2.898
-0.222
-7.13%
1 ene 1987 año
2.899
+0.001
0.04%
1 ene 1988 año
5.402
+2.503
86.36%
1 ene 1989 año
1.245
-4.156
-76.95%
1 ene 1990 año
1.278
+0.033
2.62%
1 ene 1991 año
3.288
+2.01
157.31%
1 ene 1992 año
1.558
-1.731
-52.63%
1 ene 1993 año
0.974
-0.584
-37.5%
1 ene 1994 año
0.363
-0.61
-62.69%
1 ene 1995 año
0.216
-0.148
-40.67%
1 ene 1996 año
0.279
+0.064
29.56%
1 ene 1997 año
-1.092
-1.371
-490.99%
1 ene 1998 año
-0.56
+0.532
-48.74%
1 ene 1999 año
1.048
+1.608
-287.25%
1 ene 2000 año
0.815
-0.232
-22.18%
1 ene 2001 año
0.181
-0.634
-77.77%
1 ene 2002 año
0.136
-0.046
-25.17%
1 ene 2003 año
0.347
+0.212
156.07%
1 ene 2004 año
0.425
+0.078
22.46%
1 ene 2005 año
1.064
+0.638
150.09%
1 ene 2006 año
0.081
-0.982
-92.35%
1 ene 2007 año
0.646
+0.565
694.47%
1 ene 2008 año
0.442
-0.205
-31.65%
1 ene 2009 año
0.312
-0.13
-29.37%
1 ene 2010 año
0.396
+0.084
27.03%
1 ene 2011 año
0.003
-0.393
-99.13%
1 ene 2012 año
0.055
+0.052
1.51 mil%
1 ene 2013 año
0.019
-0.036
-65.78%
1 ene 2014 año
-0.143
-0.162
-852.12%
1 ene 2015 año
0.014
+0.157
-109.87%
Ranking de los países por los datos estadísticos actuales


Comentarios: