29
/es/
es
AIzaSyAYiBZKx7MnpbEhh9jyipgxe19OcubqV5w
April 1, 2024
193386
Mauritania
MRT
true
2
1
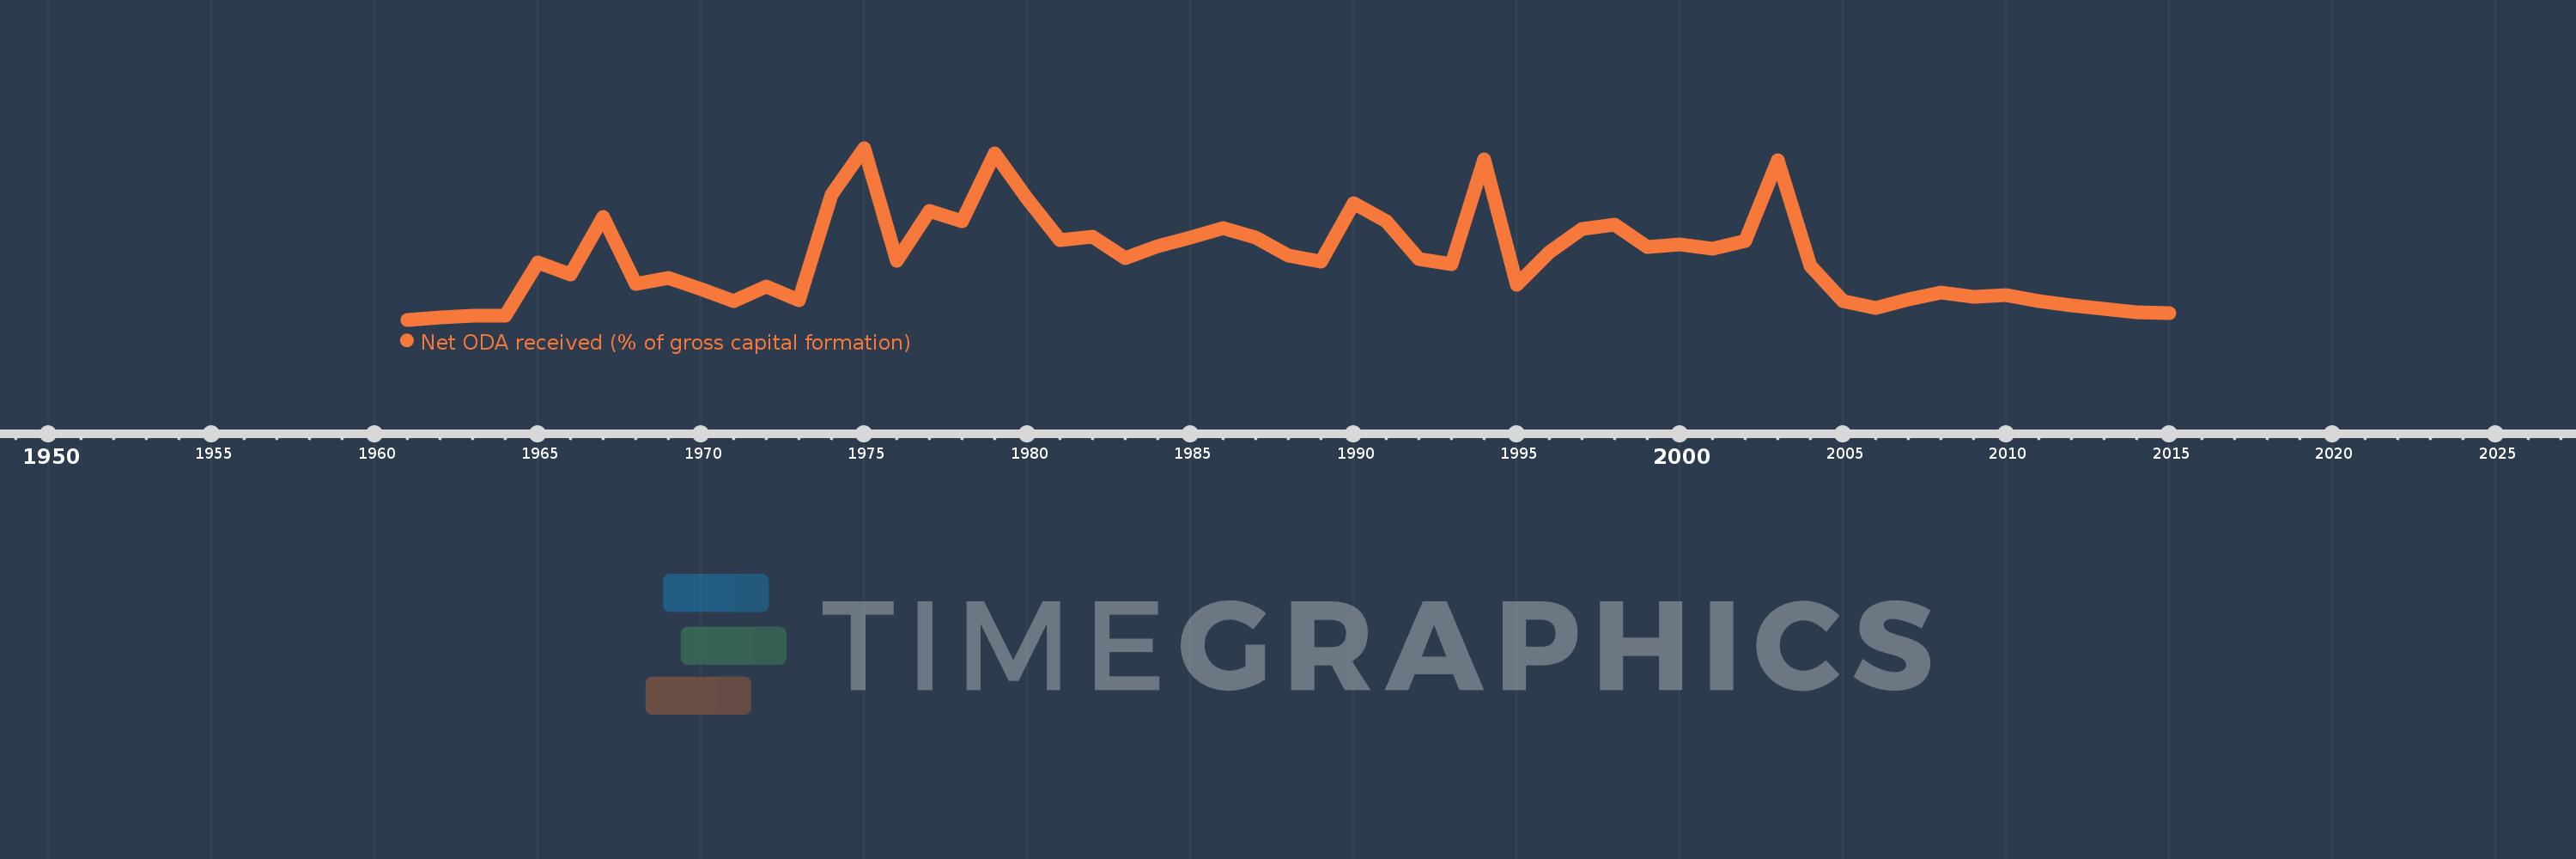
Net ODA received (% of gross capital formation)
2015,2014,2013,2012,2011,2010,2009,2008,2007,2006,2005,2004,2003,2002,2001,2000,1999,1998,1997,1996,1995,1994,1993,1992,1991,1990,1989,1988,1987,1986,1985,1984,1983,1982,1981,1980,1979,1978,1977,1976,1975,1974,1973,1972,1971,1970,1969,1968,1967,1966,1965,1964,1963,1962,1961
Estas estadísticas en otros países:
AfghanistanAlbaniaAlgeriaAngolaAntigua and BarbudaArab WorldArgentinaArmeniaArubaAzerbaijanBahamas, TheBahrainBangladeshBarbadosBelarusBelizeBeninBhutanBoliviaBosnia and HerzegovinaBotswanaBrazilBrunei DarussalamBurkina FasoBurundiCabo VerdeCambodiaCameroonCaribbean small statesCentral African RepublicCentral Europe and the BalticsChadChileChinaColombiaComorosCongo, Dem. Rep.Congo, Rep.Costa RicaCote d'IvoireCroatiaCubaCyprusDjiboutiDominicaDominican RepublicEast Asia & PacificEast Asia & Pacific (excluding high income)East Asia & Pacific (IDA & IBRD countries)EcuadorEgypt, Arab Rep.El SalvadorEquatorial GuineaEritreaEthiopiaEuro areaEurope & Central AsiaEurope & Central Asia (excluding high income)Europe & Central Asia (IDA & IBRD countries)European UnionFijiFragile and conflict affected situationsGabonGambia, TheGeorgiaGhanaGrenadaGuatemalaGuineaGuinea-BissauGuyanaHaitiHeavily indebted poor countries (HIPC)High incomeHondurasHong Kong SAR, ChinaIBRD onlyIDA & IBRD totalIDA blendIDA onlyIDA totalIndiaIndonesiaIran, Islamic Rep.IraqIsraelJamaicaJordanKazakhstanKenyaKiribatiKorea, Rep.KosovoKuwaitKyrgyz RepublicLao PDRLatin America & Caribbean Latin America & Caribbean (excluding high income)Latin America & the Caribbean (IDA & IBRD countries)Least developed countries: UN classificationLebanonLesothoLiberiaLibyaLow & middle incomeLow incomeLower middle incomeMacao SAR, ChinaMacedonia, FYRMadagascarMalawiMalaysiaMaldivesMaliMaltaMauritaniaMauritiusMexicoMiddle East & North AfricaMiddle East & North Africa (excluding high income)Middle East & North Africa (IDA & IBRD countries)Middle incomeMoldovaMongoliaMontenegroMoroccoMozambiqueNamibiaNepalNew CaledoniaNicaraguaNigerNigeriaNorth AmericaOECD membersOmanOther small statesPakistanPanamaPapua New GuineaParaguayPeruPhilippinesQatarRwandaSaudi ArabiaSenegalSerbiaSeychellesSierra LeoneSingaporeSloveniaSmall statesSolomon IslandsSouth AfricaSouth AsiaSouth Asia (IDA & IBRD)South SudanSri LankaSt. Kitts and NevisSt. LuciaSt. Vincent and the GrenadinesSub-Saharan Africa Sub-Saharan Africa (excluding high income)Sub-Saharan Africa (IDA & IBRD countries)SudanSurinameSwazilandSyrian Arab RepublicTajikistanTanzaniaThailandTimor-LesteTogoTongaTrinidad and TobagoTunisiaTurkeyTurkmenistanUgandaUkraineUpper middle incomeUruguayUzbekistanVanuatuVenezuela, RBVietnamWest Bank and GazaWorldYemen, Rep.ZambiaZimbabwe línea de tiempo (timeline):
En esta escala de tiempo se presenta un gráfico de 1961 y 2015 de Mauritania. Los datos de 1960 están ausentes. El número de observaciones reales por fecha: 55.
Fuente (nombre):
Indicadores del desarrollo mundial
Fuente (organización):
Development Assistance Committee of the Organisation for Economic Co-operation and Development, Geographical Distribution of Financial Flows to Developing Countries, Development Co-operation Report, and International Development Statistics database. Data are available online at: www.oecd.org/dac/stats/idsonline. World Bank gross capital formation estimates are used for the denominator.
Categorías:
Aid Effectiveness
Se ha actualizado:
23 abr 2017 año
Los indicadores de los cambios de valor en los últimos años
Mínimo:
0.191
1 ene 1961 año
Máximo:
202.293
1 ene 1975 año
A la fecha de observación
Valor
Cambio absoluto
El cambio con respecto al valor anterior
1 ene 1961 año
0.191
+0.191
0.0%
1 ene 1962 año
2.649
+2.458
1.29 mil%
1 ene 1963 año
4.664
+2.015
76.08%
1 ene 1964 año
5.404
+0.74
15.85%
1 ene 1965 año
68.04
+62.636
1.16 mil%
1 ene 1966 año
53.255
-14.785
-21.73%
1 ene 1967 año
120.692
+67.437
126.63%
1 ene 1968 año
41.961
-78.731
-65.23%
1 ene 1969 año
49.894
+7.933
18.9%
1 ene 1970 año
36.32
-13.574
-27.21%
1 ene 1971 año
22.442
-13.878
-38.21%
1 ene 1972 año
38.806
+16.364
72.92%
1 ene 1973 año
22.832
-15.973
-41.16%
1 ene 1974 año
147.603
+124.77
546.47%
1 ene 1975 año
202.293
+54.69
37.05%
1 ene 1976 año
69.83
-132.463
-65.48%
1 ene 1977 año
127.77
+57.939
82.97%
1 ene 1978 año
115.953
-11.817
-9.25%
1 ene 1979 año
196.056
+80.104
69.08%
1 ene 1980 año
142.637
-53.419
-27.25%
1 ene 1981 año
94.059
-48.578
-34.06%
1 ene 1982 año
98.106
+4.047
4.3%
1 ene 1983 año
73.122
-24.984
-25.47%
1 ene 1984 año
86.29
+13.169
18.01%
1 ene 1985 año
97.215
+10.924
12.66%
1 ene 1986 año
107.837
+10.622
10.93%
1 ene 1987 año
96.441
-11.396
-10.57%
1 ene 1988 año
75.256
-21.185
-21.97%
1 ene 1989 año
68.26
-6.996
-9.3%
1 ene 1990 año
137.508
+69.248
101.45%
1 ene 1991 año
116.016
-21.492
-15.63%
1 ene 1992 año
71.903
-44.113
-38.02%
1 ene 1993 año
65.943
-5.96
-8.29%
1 ene 1994 año
188.437
+122.494
185.76%
1 ene 1995 año
41.563
-146.874
-77.94%
1 ene 1996 año
79.691
+38.129
91.74%
1 ene 1997 año
106.927
+27.235
34.18%
1 ene 1998 año
112.409
+5.482
5.13%
1 ene 1999 año
86.199
-26.21
-23.32%
1 ene 2000 año
89.044
+2.845
3.3%
1 ene 2001 año
83.729
-5.315
-5.97%
1 ene 2002 año
92.762
+9.033
10.79%
1 ene 2003 año
188.239
+95.476
102.93%
1 ene 2004 año
63.594
-124.645
-66.22%
1 ene 2005 año
22.461
-41.133
-64.68%
1 ene 2006 año
14.053
-8.407
-37.43%
1 ene 2007 año
24.073
+10.019
71.3%
1 ene 2008 año
32.578
+8.505
35.33%
1 ene 2009 año
26.913
-5.665
-17.39%
1 ene 2010 año
29.257
+2.345
8.71%
1 ene 2011 año
21.79
-7.468
-25.52%
1 ene 2012 año
16.967
-4.823
-22.13%
1 ene 2013 año
13.262
-3.705
-21.84%
1 ene 2014 año
9.278
-3.984
-30.04%
1 ene 2015 año
8.319
-0.959
-10.34%
Ranking de los países por los datos estadísticos actuales


Comentarios: