29
/es/
es
AIzaSyAYiBZKx7MnpbEhh9jyipgxe19OcubqV5w
April 1, 2024
278043
Uruguay
URY
true
2
1
Net ODA received (% of gross capital formation)
2015,2014,2013,2012,2011,2010,2009,2008,2007,2006,2005,2004,2003,2002,2001,2000,1999,1998,1997,1996,1995,1994,1993,1992,1991,1990,1989,1988,1987,1986,1985,1984,1983,1982,1981,1980,1979,1978,1977,1976,1975,1974,1973,1972,1971,1970,1969,1968,1967
Estas estadísticas en otros países:
AfghanistanAlbaniaAlgeriaAngolaAntigua and BarbudaArab WorldArgentinaArmeniaArubaAzerbaijanBahamas, TheBahrainBangladeshBarbadosBelarusBelizeBeninBhutanBoliviaBosnia and HerzegovinaBotswanaBrazilBrunei DarussalamBurkina FasoBurundiCabo VerdeCambodiaCameroonCaribbean small statesCentral African RepublicCentral Europe and the BalticsChadChileChinaColombiaComorosCongo, Dem. Rep.Congo, Rep.Costa RicaCote d'IvoireCroatiaCubaCyprusDjiboutiDominicaDominican RepublicEast Asia & PacificEast Asia & Pacific (excluding high income)East Asia & Pacific (IDA & IBRD countries)EcuadorEgypt, Arab Rep.El SalvadorEquatorial GuineaEritreaEthiopiaEuro areaEurope & Central AsiaEurope & Central Asia (excluding high income)Europe & Central Asia (IDA & IBRD countries)European UnionFijiFragile and conflict affected situationsGabonGambia, TheGeorgiaGhanaGrenadaGuatemalaGuineaGuinea-BissauGuyanaHaitiHeavily indebted poor countries (HIPC)High incomeHondurasHong Kong SAR, ChinaIBRD onlyIDA & IBRD totalIDA blendIDA onlyIDA totalIndiaIndonesiaIran, Islamic Rep.IraqIsraelJamaicaJordanKazakhstanKenyaKiribatiKorea, Rep.KosovoKuwaitKyrgyz RepublicLao PDRLatin America & Caribbean Latin America & Caribbean (excluding high income)Latin America & the Caribbean (IDA & IBRD countries)Least developed countries: UN classificationLebanonLesothoLiberiaLibyaLow & middle incomeLow incomeLower middle incomeMacao SAR, ChinaMacedonia, FYRMadagascarMalawiMalaysiaMaldivesMaliMaltaMauritaniaMauritiusMexicoMiddle East & North AfricaMiddle East & North Africa (excluding high income)Middle East & North Africa (IDA & IBRD countries)Middle incomeMoldovaMongoliaMontenegroMoroccoMozambiqueNamibiaNepalNew CaledoniaNicaraguaNigerNigeriaNorth AmericaOECD membersOmanOther small statesPakistanPanamaPapua New GuineaParaguayPeruPhilippinesQatarRwandaSaudi ArabiaSenegalSerbiaSeychellesSierra LeoneSingaporeSloveniaSmall statesSolomon IslandsSouth AfricaSouth AsiaSouth Asia (IDA & IBRD)South SudanSri LankaSt. Kitts and NevisSt. LuciaSt. Vincent and the GrenadinesSub-Saharan Africa Sub-Saharan Africa (excluding high income)Sub-Saharan Africa (IDA & IBRD countries)SudanSurinameSwazilandSyrian Arab RepublicTajikistanTanzaniaThailandTimor-LesteTogoTongaTrinidad and TobagoTunisiaTurkeyTurkmenistanUgandaUkraineUpper middle incomeUruguayUzbekistanVanuatuVenezuela, RBVietnamWest Bank and GazaWorldYemen, Rep.ZambiaZimbabwe línea de tiempo (timeline):
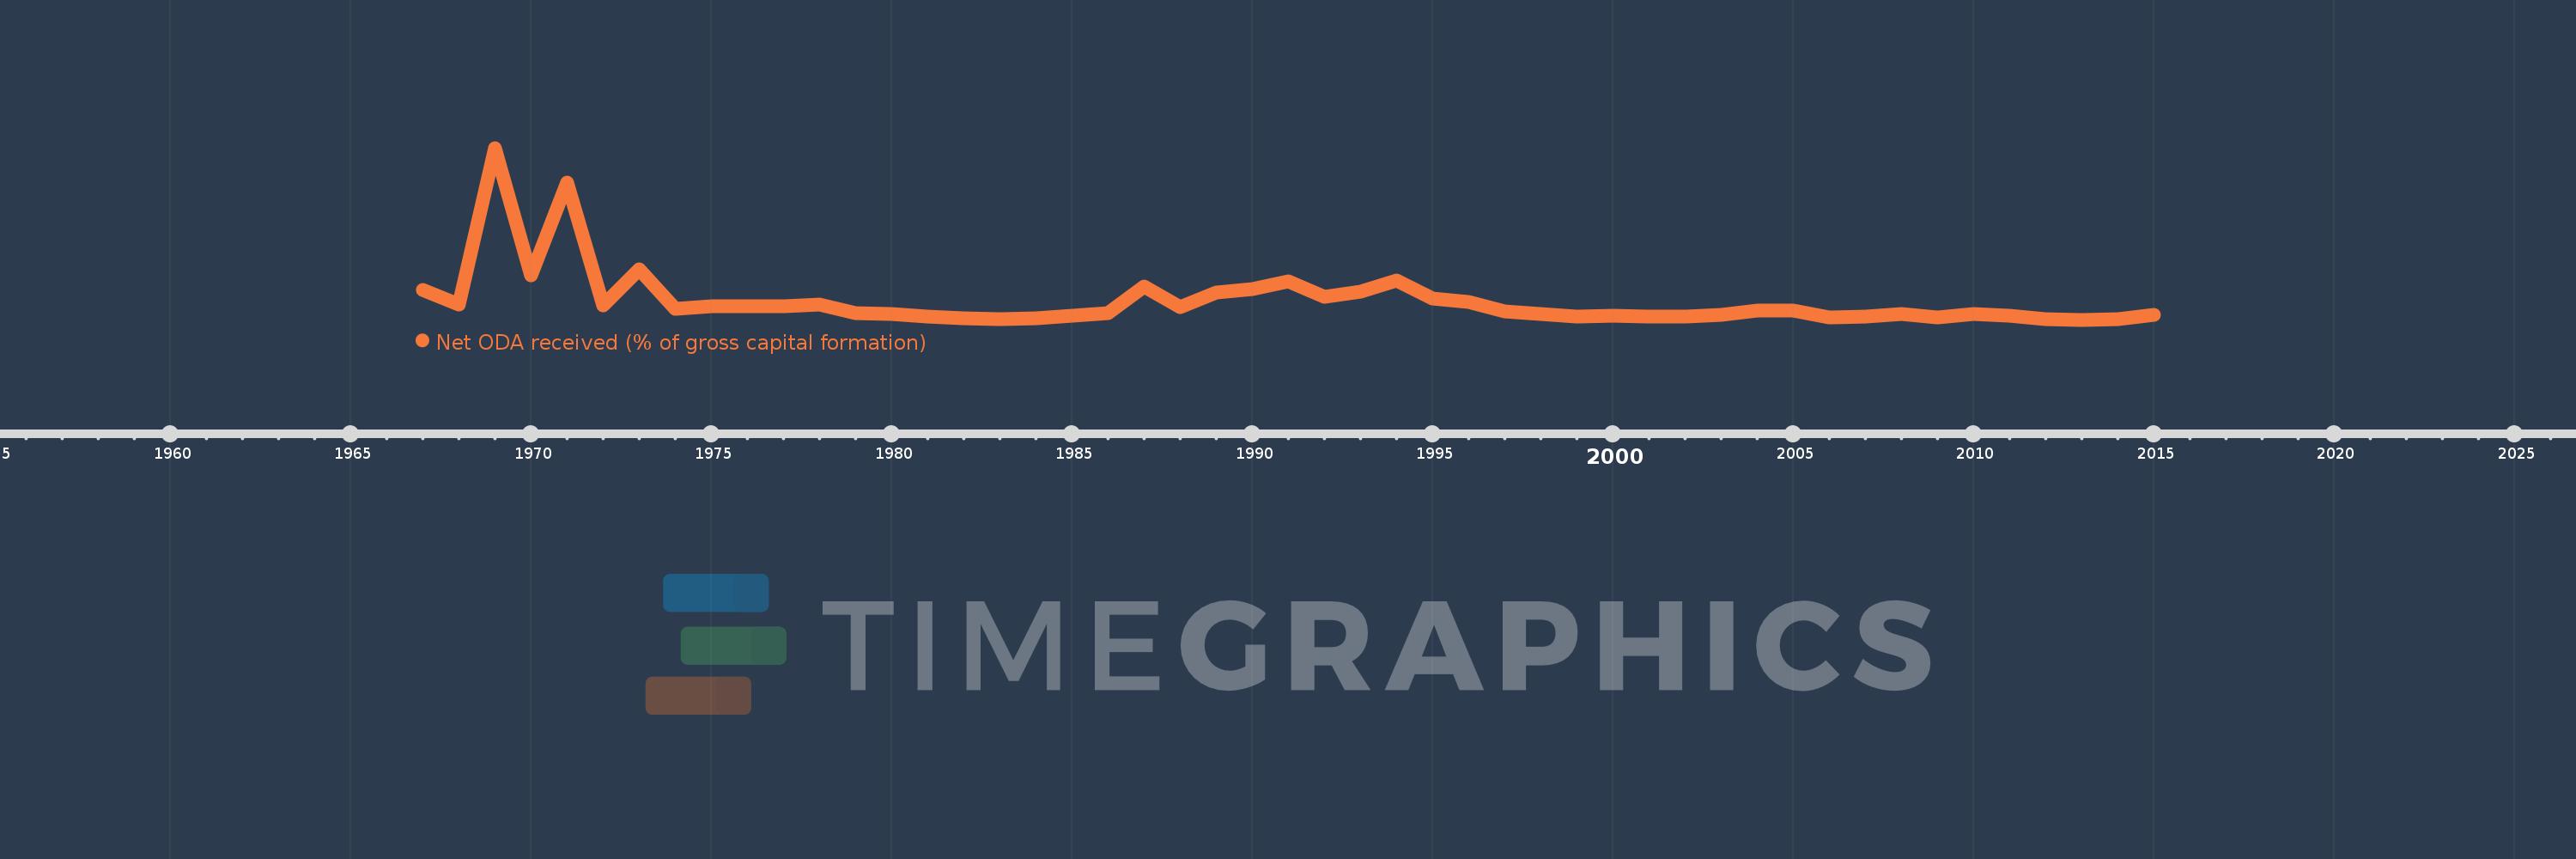
En esta escala de tiempo se presenta un gráfico de 1967 y 2015 de Uruguay. Los datos de 1966 están ausentes. El número de observaciones reales por fecha: 49.
Fuente (nombre):
Indicadores del desarrollo mundial
Fuente (organización):
Development Assistance Committee of the Organisation for Economic Co-operation and Development, Geographical Distribution of Financial Flows to Developing Countries, Development Co-operation Report, and International Development Statistics database. Data are available online at: www.oecd.org/dac/stats/idsonline. World Bank gross capital formation estimates are used for the denominator.
Categorías:
Aid Effectiveness
Se ha actualizado:
23 abr 2017 año
Los indicadores de los cambios de valor en los últimos años
Mínimo:
0.164
1 ene 2013 año
Máximo:
20.273
1 ene 1969 año
A la fecha de observación
Valor
Cambio absoluto
El cambio con respecto al valor anterior
1 ene 1967 año
3.696
+3.696
0.0%
1 ene 1968 año
1.933
-1.762
-47.69%
1 ene 1969 año
20.273
+18.34
948.63%
1 ene 1970 año
5.389
-14.884
-73.42%
1 ene 1971 año
16.267
+10.878
201.85%
1 ene 1972 año
1.883
-14.383
-88.42%
1 ene 1973 año
6.028
+4.145
220.06%
1 ene 1974 año
1.44
-4.588
-76.12%
1 ene 1975 año
1.725
+0.286
19.83%
1 ene 1976 año
1.778
+0.052
3.04%
1 ene 1977 año
1.707
-0.071
-3.97%
1 ene 1978 año
1.929
+0.222
13.03%
1 ene 1979 año
0.911
-1.018
-52.78%
1 ene 1980 año
0.805
-0.107
-11.69%
1 ene 1981 año
0.547
-0.257
-31.98%
1 ene 1982 año
0.3
-0.248
-45.23%
1 ene 1983 año
0.197
-0.103
-34.24%
1 ene 1984 año
0.345
+0.148
75.2%
1 ene 1985 año
0.648
+0.302
87.58%
1 ene 1986 año
0.89
+0.242
37.38%
1 ene 1987 año
4.019
+3.129
351.57%
1 ene 1988 año
1.669
-2.35
-58.47%
1 ene 1989 año
3.372
+1.703
102.03%
1 ene 1990 año
3.763
+0.391
11.61%
1 ene 1991 año
4.621
+0.858
22.8%
1 ene 1992 año
2.88
-1.741
-37.67%
1 ene 1993 año
3.471
+0.591
20.52%
1 ene 1994 año
4.77
+1.299
37.42%
1 ene 1995 año
2.623
-2.147
-45.01%
1 ene 1996 año
2.208
-0.415
-15.82%
1 ene 1997 año
1.096
-1.113
-50.38%
1 ene 1998 año
0.847
-0.249
-22.68%
1 ene 1999 año
0.548
-0.299
-35.26%
1 ene 2000 año
0.608
+0.059
10.79%
1 ene 2001 año
0.527
-0.08
-13.21%
1 ene 2002 año
0.507
-0.02
-3.8%
1 ene 2003 año
0.771
+0.264
52.05%
1 ene 2004 año
1.287
+0.516
66.9%
1 ene 2005 año
1.215
-0.072
-5.61%
1 ene 2006 año
0.47
-0.745
-61.33%
1 ene 2007 año
0.553
+0.083
17.68%
1 ene 2008 año
0.81
+0.257
46.41%
1 ene 2009 año
0.472
-0.337
-41.66%
1 ene 2010 año
0.805
+0.333
70.46%
1 ene 2011 año
0.597
-0.208
-25.83%
1 ene 2012 año
0.223
-0.374
-62.58%
1 ene 2013 año
0.164
-0.059
-26.4%
1 ene 2014 año
0.278
+0.114
69.13%
1 ene 2015 año
0.731
+0.453
162.81%
Ranking de los países por los datos estadísticos actuales


Comentarios: