29
/es/
es
AIzaSyAYiBZKx7MnpbEhh9jyipgxe19OcubqV5w
April 1, 2024
267195
Trinidad and Tobago
TTO
true
2
1
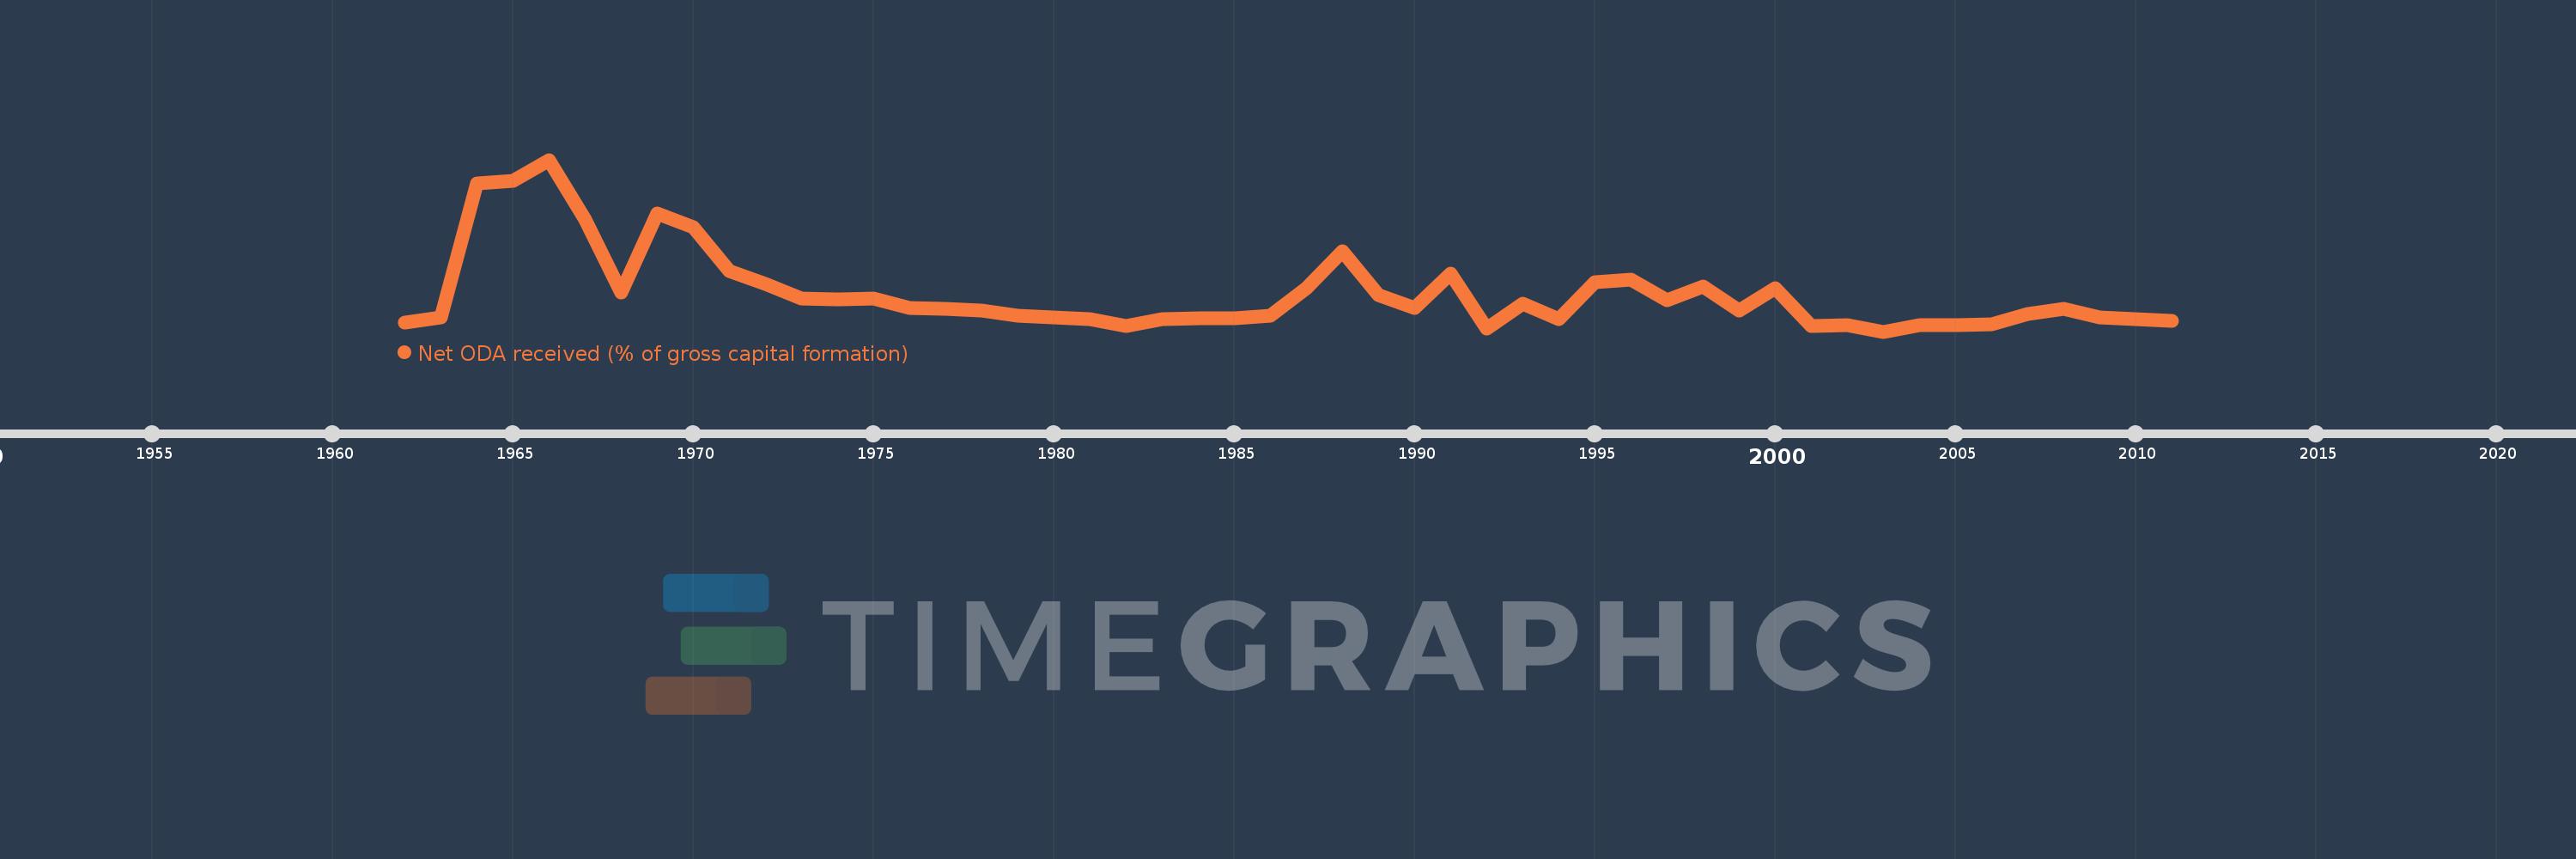
Net ODA received (% of gross capital formation)
2011,2010,2009,2008,2007,2006,2005,2004,2003,2002,2001,2000,1999,1998,1997,1996,1995,1994,1993,1992,1991,1990,1989,1988,1987,1986,1985,1984,1983,1982,1981,1980,1979,1978,1977,1976,1975,1974,1973,1972,1971,1970,1969,1968,1967,1966,1965,1964,1963,1962
Estas estadísticas en otros países:
AfghanistanAlbaniaAlgeriaAngolaAntigua and BarbudaArab WorldArgentinaArmeniaArubaAzerbaijanBahamas, TheBahrainBangladeshBarbadosBelarusBelizeBeninBhutanBoliviaBosnia and HerzegovinaBotswanaBrazilBrunei DarussalamBurkina FasoBurundiCabo VerdeCambodiaCameroonCaribbean small statesCentral African RepublicCentral Europe and the BalticsChadChileChinaColombiaComorosCongo, Dem. Rep.Congo, Rep.Costa RicaCote d'IvoireCroatiaCubaCyprusDjiboutiDominicaDominican RepublicEast Asia & PacificEast Asia & Pacific (excluding high income)East Asia & Pacific (IDA & IBRD countries)EcuadorEgypt, Arab Rep.El SalvadorEquatorial GuineaEritreaEthiopiaEuro areaEurope & Central AsiaEurope & Central Asia (excluding high income)Europe & Central Asia (IDA & IBRD countries)European UnionFijiFragile and conflict affected situationsGabonGambia, TheGeorgiaGhanaGrenadaGuatemalaGuineaGuinea-BissauGuyanaHaitiHeavily indebted poor countries (HIPC)High incomeHondurasHong Kong SAR, ChinaIBRD onlyIDA & IBRD totalIDA blendIDA onlyIDA totalIndiaIndonesiaIran, Islamic Rep.IraqIsraelJamaicaJordanKazakhstanKenyaKiribatiKorea, Rep.KosovoKuwaitKyrgyz RepublicLao PDRLatin America & Caribbean Latin America & Caribbean (excluding high income)Latin America & the Caribbean (IDA & IBRD countries)Least developed countries: UN classificationLebanonLesothoLiberiaLibyaLow & middle incomeLow incomeLower middle incomeMacao SAR, ChinaMacedonia, FYRMadagascarMalawiMalaysiaMaldivesMaliMaltaMauritaniaMauritiusMexicoMiddle East & North AfricaMiddle East & North Africa (excluding high income)Middle East & North Africa (IDA & IBRD countries)Middle incomeMoldovaMongoliaMontenegroMoroccoMozambiqueNamibiaNepalNew CaledoniaNicaraguaNigerNigeriaNorth AmericaOECD membersOmanOther small statesPakistanPanamaPapua New GuineaParaguayPeruPhilippinesQatarRwandaSaudi ArabiaSenegalSerbiaSeychellesSierra LeoneSingaporeSloveniaSmall statesSolomon IslandsSouth AfricaSouth AsiaSouth Asia (IDA & IBRD)South SudanSri LankaSt. Kitts and NevisSt. LuciaSt. Vincent and the GrenadinesSub-Saharan Africa Sub-Saharan Africa (excluding high income)Sub-Saharan Africa (IDA & IBRD countries)SudanSurinameSwazilandSyrian Arab RepublicTajikistanTanzaniaThailandTimor-LesteTogoTongaTrinidad and TobagoTunisiaTurkeyTurkmenistanUgandaUkraineUpper middle incomeUruguayUzbekistanVanuatuVenezuela, RBVietnamWest Bank and GazaWorldYemen, Rep.ZambiaZimbabwe línea de tiempo (timeline):
En esta escala de tiempo se presenta un gráfico de 1962 y 2011 de Trinidad and Tobago. Los datos de 1961 están ausentes. El número de observaciones reales por fecha: 50.
Fuente (nombre):
Indicadores del desarrollo mundial
Fuente (organización):
Development Assistance Committee of the Organisation for Economic Co-operation and Development, Geographical Distribution of Financial Flows to Developing Countries, Development Co-operation Report, and International Development Statistics database. Data are available online at: www.oecd.org/dac/stats/idsonline. World Bank gross capital formation estimates are used for the denominator.
Categorías:
Aid Effectiveness
Se ha actualizado:
23 abr 2017 año
Los indicadores de los cambios de valor en los últimos años
Mínimo:
-0.421
1 ene 2003 año
Máximo:
8.503
1 ene 1966 año
A la fecha de observación
Valor
Cambio absoluto
El cambio con respecto al valor anterior
1 ene 1962 año
0.054
+0.054
0.0%
1 ene 1963 año
0.316
+0.263
490.9%
1 ene 1964 año
7.269
+6.952
2.2 mil%
1 ene 1965 año
7.397
+0.128
1.77%
1 ene 1966 año
8.503
+1.106
14.96%
1 ene 1967 año
5.417
-3.087
-36.3%
1 ene 1968 año
1.595
-3.822
-70.55%
1 ene 1969 año
5.735
+4.14
259.57%
1 ene 1970 año
5.004
-0.731
-12.75%
1 ene 1971 año
2.72
-2.284
-45.64%
1 ene 1972 año
2.051
-0.669
-24.59%
1 ene 1973 año
1.294
-0.757
-36.92%
1 ene 1974 año
1.236
-0.057
-4.43%
1 ene 1975 año
1.283
+0.047
3.78%
1 ene 1976 año
0.807
-0.476
-37.12%
1 ene 1977 año
0.767
-0.04
-4.93%
1 ene 1978 año
0.658
-0.11
-14.29%
1 ene 1979 año
0.414
-0.243
-36.99%
1 ene 1980 año
0.303
-0.111
-26.81%
1 ene 1981 año
0.206
-0.097
-32.08%
1 ene 1982 año
-0.11
-0.316
-153.27%
1 ene 1983 año
0.238
+0.347
-316.67%
1 ene 1984 año
0.254
+0.016
6.86%
1 ene 1985 año
0.258
+0.004
1.54%
1 ene 1986 año
0.414
+0.156
60.39%
1 ene 1987 año
1.848
+1.435
346.85%
1 ene 1988 año
3.738
+1.889
102.21%
1 ene 1989 año
1.464
-2.274
-60.84%
1 ene 1990 año
0.817
-0.647
-44.2%
1 ene 1991 año
2.58
+1.763
215.93%
1 ene 1992 año
-0.259
-2.839
-110.03%
1 ene 1993 año
1.011
+1.269
-490.51%
1 ene 1994 año
0.221
-0.789
-78.11%
1 ene 1995 año
2.137
+1.915
865.61%
1 ene 1996 año
2.267
+0.13
6.09%
1 ene 1997 año
1.19
-1.077
-47.52%
1 ene 1998 año
1.926
+0.737
61.93%
1 ene 1999 año
0.688
-1.239
-64.31%
1 ene 2000 año
1.852
+1.165
169.42%
1 ene 2001 año
-0.112
-1.964
-106.03%
1 ene 2002 año
-0.073
+0.038
-34.35%
1 ene 2003 año
-0.421
-0.348
473.62%
1 ene 2004 año
-0.102
+0.319
-75.81%
1 ene 2005 año
-0.069
+0.033
-32.62%
1 ene 2006 año
-0.041
+0.028
-40.17%
1 ene 2007 año
0.481
+0.522
-1.27 mil%
1 ene 2008 año
0.745
+0.264
54.98%
1 ene 2009 año
0.301
-0.444
-59.61%
1 ene 2010 año
0.231
-0.07
-23.34%
1 ene 2011 año
0.146
-0.085
-36.78%
Ranking de los países por los datos estadísticos actuales


Comentarios: