29
/es/
es
AIzaSyAYiBZKx7MnpbEhh9jyipgxe19OcubqV5w
April 1, 2024
79396
Barbados
BRB
true
2
1
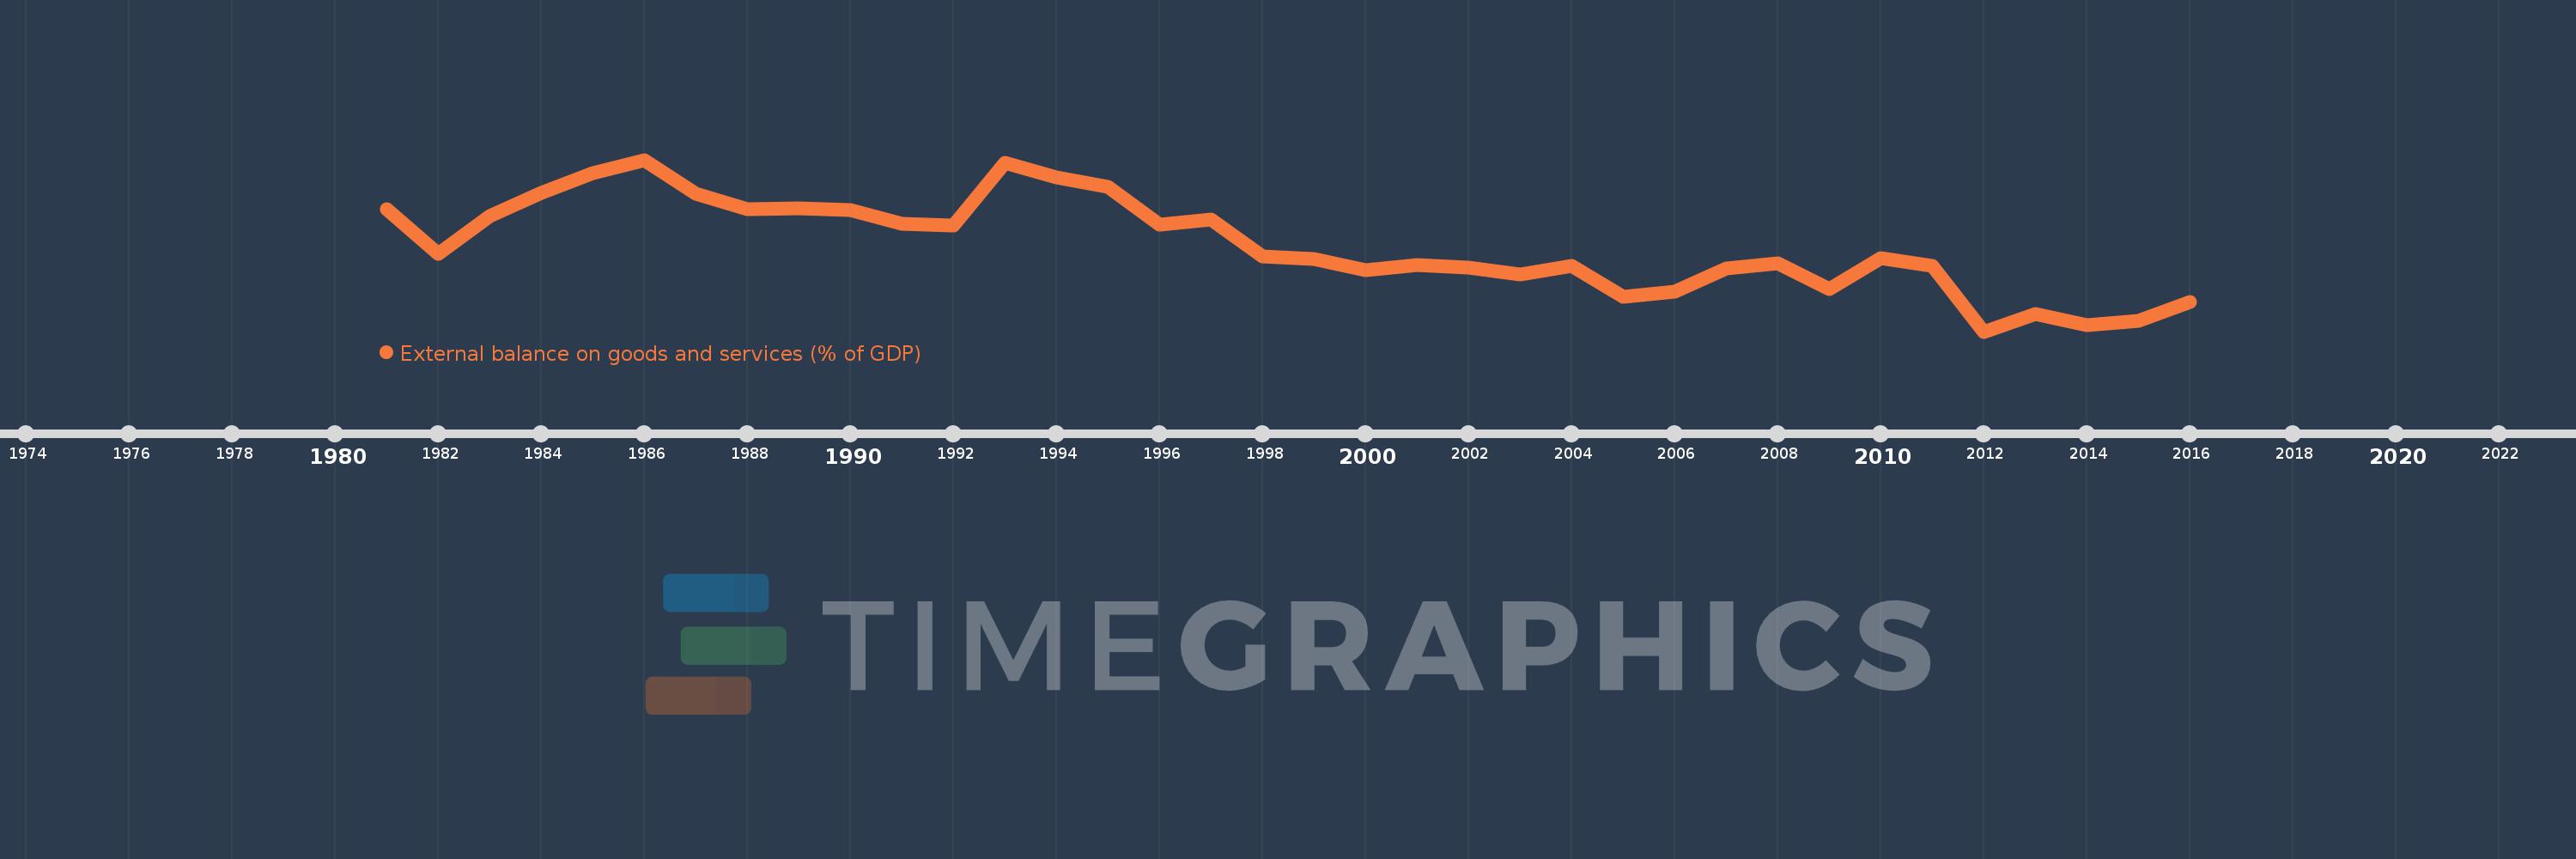
External balance on goods and services (% of GDP)
2016,2015,2014,2013,2012,2011,2010,2009,2008,2007,2006,2005,2004,2003,2002,2001,2000,1999,1998,1997,1996,1995,1994,1993,1992,1991,1990,1989,1988,1987,1986,1985,1984,1983,1982,1981
Estas estadísticas en otros países:
AfghanistanAlbaniaAlgeriaAngolaAntigua and BarbudaArab WorldArgentinaArmeniaArubaAustraliaAustriaAzerbaijanBahamas, TheBahrainBangladeshBarbadosBelarusBelgiumBelizeBeninBermudaBhutanBoliviaBosnia and HerzegovinaBotswanaBrazilBrunei DarussalamBulgariaBurkina FasoBurundiCabo VerdeCambodiaCameroonCanadaCaribbean small statesCentral African RepublicCentral Europe and the BalticsChadChileChinaColombiaComorosCongo, Dem. Rep.Congo, Rep.Costa RicaCote d'IvoireCroatiaCubaCyprusCzech RepublicDenmarkDjiboutiDominicaDominican RepublicEarly-demographic dividendEast Asia & PacificEast Asia & Pacific (excluding high income)East Asia & Pacific (IDA & IBRD countries)EcuadorEgypt, Arab Rep.El SalvadorEquatorial GuineaEritreaEstoniaEthiopiaEuro areaEurope & Central AsiaEurope & Central Asia (excluding high income)Europe & Central Asia (IDA & IBRD countries)European UnionFaroe IslandsFijiFinlandFragile and conflict affected situationsFranceFrench PolynesiaGabonGambia, TheGeorgiaGermanyGhanaGreeceGrenadaGuatemalaGuineaGuinea-BissauGuyanaHaitiHeavily indebted poor countries (HIPC)High incomeHondurasHong Kong SAR, ChinaHungaryIBRD onlyIcelandIDA & IBRD totalIDA blendIDA onlyIDA totalIndiaIndonesiaIran, Islamic Rep.IraqIrelandIsraelItalyJamaicaJapanJordanKazakhstanKenyaKiribatiKorea, Rep.KosovoKuwaitKyrgyz RepublicLao PDRLate-demographic dividendLatin America & Caribbean Latin America & Caribbean (excluding high income)Latin America & the Caribbean (IDA & IBRD countries)LatviaLeast developed countries: UN classificationLebanonLesothoLiberiaLibyaLithuaniaLow & middle incomeLow incomeLower middle incomeLuxembourgMacao SAR, ChinaMacedonia, FYRMadagascarMalawiMalaysiaMaldivesMaliMaltaMauritaniaMauritiusMexicoMicronesia, Fed. Sts.Middle East & North AfricaMiddle East & North Africa (excluding high income)Middle East & North Africa (IDA & IBRD countries)Middle incomeMoldovaMongoliaMontenegroMoroccoMozambiqueMyanmarNamibiaNepalNetherlandsNew CaledoniaNew ZealandNicaraguaNigerNigeriaNorth AmericaNorwayOECD membersOmanOther small statesPacific island small statesPakistanPalauPanamaPapua New GuineaParaguayPeruPhilippinesPolandPortugalPost-demographic dividendPre-demographic dividendPuerto RicoQatarRomaniaRussian FederationRwandaSamoaSaudi ArabiaSenegalSerbiaSeychellesSierra LeoneSingaporeSlovak RepublicSloveniaSmall statesSolomon IslandsSomaliaSouth AfricaSouth AsiaSouth Asia (IDA & IBRD)South SudanSpainSri LankaSt. Kitts and NevisSt. LuciaSt. Vincent and the GrenadinesSub-Saharan Africa Sub-Saharan Africa (excluding high income)Sub-Saharan Africa (IDA & IBRD countries)SudanSurinameSwazilandSwedenSwitzerlandSyrian Arab RepublicTajikistanTanzaniaThailandTimor-LesteTogoTongaTrinidad and TobagoTunisiaTurkeyTurkmenistanUgandaUkraineUnited Arab EmiratesUnited KingdomUnited StatesUpper middle incomeUruguayUzbekistanVanuatuVenezuela, RBVietnamWest Bank and GazaWorldYemen, Rep.ZambiaZimbabwe línea de tiempo (timeline):
En esta escala de tiempo se presenta un gráfico de 1981 y 2016 de Barbados. Los datos de 1980 están ausentes. El número de observaciones reales por fecha: 36.
Fuente (nombre):
Indicadores del desarrollo mundial
Fuente (organización):
World Bank national accounts data, and OECD National Accounts data files.
Categorías:
Economy & Growth, Trade
Se ha actualizado:
23 abr 2017 año
Los indicadores de los cambios de valor en los últimos años
Mínimo:
-13.486
1 ene 2012 año
Máximo:
11.002
1 ene 1986 año
A la fecha de observación
Valor
Cambio absoluto
El cambio con respecto al valor anterior
1 ene 1981 año
3.985
+3.985
0.0%
1 ene 1982 año
-2.355
-6.34
-159.09%
1 ene 1983 año
2.953
+5.308
-225.4%
1 ene 1984 año
6.311
+3.358
113.7%
1 ene 1985 año
9.123
+2.812
44.56%
1 ene 1986 año
11.002
+1.879
20.6%
1 ene 1987 año
6.106
-4.896
-44.5%
1 ene 1988 año
3.954
-2.152
-35.24%
1 ene 1989 año
4.119
+0.165
4.16%
1 ene 1990 año
3.859
-0.26
-6.32%
1 ene 1991 año
1.827
-2.032
-52.65%
1 ene 1992 año
1.621
-0.207
-11.31%
1 ene 1993 año
10.531
+8.91
549.8%
1 ene 1994 año
8.519
-2.012
-19.11%
1 ene 1995 año
7.091
-1.428
-16.76%
1 ene 1996 año
1.789
-5.301
-74.77%
1 ene 1997 año
2.515
+0.726
40.57%
1 ene 1998 año
-2.713
-5.228
-207.87%
1 ene 1999 año
-3.193
-0.48
17.7%
1 ene 2000 año
-4.723
-1.53
47.9%
1 ene 2001 año
-4.025
+0.697
-14.77%
1 ene 2002 año
-4.33
-0.305
7.57%
1 ene 2003 año
-5.39
-1.06
24.49%
1 ene 2004 año
-4.092
+1.298
-24.09%
1 ene 2005 año
-8.501
-4.409
107.75%
1 ene 2006 año
-7.827
+0.674
-7.93%
1 ene 2007 año
-4.488
+3.338
-42.65%
1 ene 2008 año
-3.789
+0.699
-15.58%
1 ene 2009 año
-7.467
-3.679
97.09%
1 ene 2010 año
-3.049
+4.418
-59.17%
1 ene 2011 año
-4.172
-1.122
36.81%
1 ene 2012 año
-13.486
-9.315
223.29%
1 ene 2013 año
-10.925
+2.561
-18.99%
1 ene 2014 año
-12.602
-1.676
15.35%
1 ene 2015 año
-11.978
+0.624
-4.95%
1 ene 2016 año
-9.255
+2.723
-22.73%
Ranking de los países por los datos estadísticos actuales


Comentarios: