29
/es/
es
AIzaSyAYiBZKx7MnpbEhh9jyipgxe19OcubqV5w
April 1, 2024
191356
Malta
MLT
true
2
1
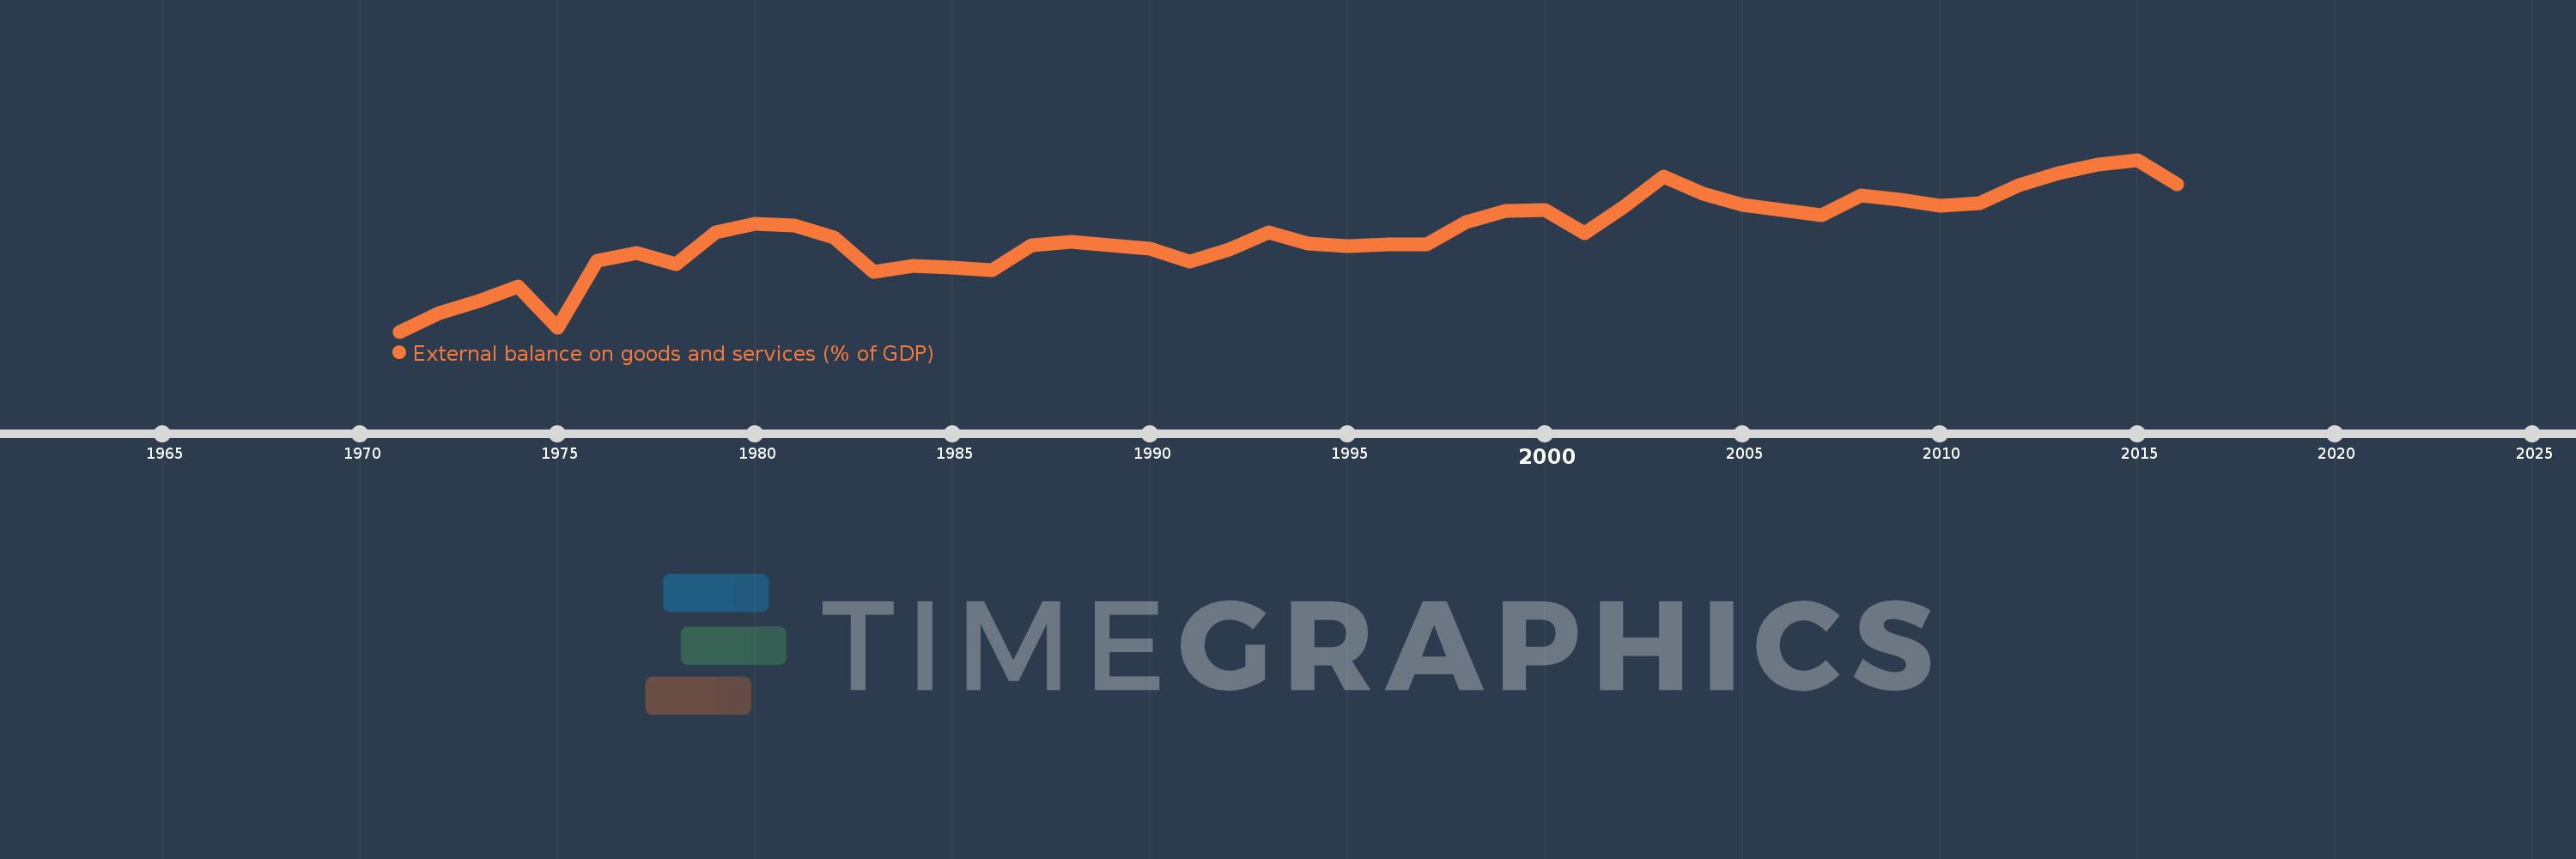
External balance on goods and services (% of GDP)
2016,2015,2014,2013,2012,2011,2010,2009,2008,2007,2006,2005,2004,2003,2002,2001,2000,1999,1998,1997,1996,1995,1994,1993,1992,1991,1990,1989,1988,1987,1986,1985,1984,1983,1982,1981,1980,1979,1978,1977,1976,1975,1974,1973,1972,1971
Estas estadísticas en otros países:
AfghanistanAlbaniaAlgeriaAngolaAntigua and BarbudaArab WorldArgentinaArmeniaArubaAustraliaAustriaAzerbaijanBahamas, TheBahrainBangladeshBarbadosBelarusBelgiumBelizeBeninBermudaBhutanBoliviaBosnia and HerzegovinaBotswanaBrazilBrunei DarussalamBulgariaBurkina FasoBurundiCabo VerdeCambodiaCameroonCanadaCaribbean small statesCentral African RepublicCentral Europe and the BalticsChadChileChinaColombiaComorosCongo, Dem. Rep.Congo, Rep.Costa RicaCote d'IvoireCroatiaCubaCyprusCzech RepublicDenmarkDjiboutiDominicaDominican RepublicEarly-demographic dividendEast Asia & PacificEast Asia & Pacific (excluding high income)East Asia & Pacific (IDA & IBRD countries)EcuadorEgypt, Arab Rep.El SalvadorEquatorial GuineaEritreaEstoniaEthiopiaEuro areaEurope & Central AsiaEurope & Central Asia (excluding high income)Europe & Central Asia (IDA & IBRD countries)European UnionFaroe IslandsFijiFinlandFragile and conflict affected situationsFranceFrench PolynesiaGabonGambia, TheGeorgiaGermanyGhanaGreeceGrenadaGuatemalaGuineaGuinea-BissauGuyanaHaitiHeavily indebted poor countries (HIPC)High incomeHondurasHong Kong SAR, ChinaHungaryIBRD onlyIcelandIDA & IBRD totalIDA blendIDA onlyIDA totalIndiaIndonesiaIran, Islamic Rep.IraqIrelandIsraelItalyJamaicaJapanJordanKazakhstanKenyaKiribatiKorea, Rep.KosovoKuwaitKyrgyz RepublicLao PDRLate-demographic dividendLatin America & Caribbean Latin America & Caribbean (excluding high income)Latin America & the Caribbean (IDA & IBRD countries)LatviaLeast developed countries: UN classificationLebanonLesothoLiberiaLibyaLithuaniaLow & middle incomeLow incomeLower middle incomeLuxembourgMacao SAR, ChinaMacedonia, FYRMadagascarMalawiMalaysiaMaldivesMaliMaltaMauritaniaMauritiusMexicoMicronesia, Fed. Sts.Middle East & North AfricaMiddle East & North Africa (excluding high income)Middle East & North Africa (IDA & IBRD countries)Middle incomeMoldovaMongoliaMontenegroMoroccoMozambiqueMyanmarNamibiaNepalNetherlandsNew CaledoniaNew ZealandNicaraguaNigerNigeriaNorth AmericaNorwayOECD membersOmanOther small statesPacific island small statesPakistanPalauPanamaPapua New GuineaParaguayPeruPhilippinesPolandPortugalPost-demographic dividendPre-demographic dividendPuerto RicoQatarRomaniaRussian FederationRwandaSamoaSaudi ArabiaSenegalSerbiaSeychellesSierra LeoneSingaporeSlovak RepublicSloveniaSmall statesSolomon IslandsSomaliaSouth AfricaSouth AsiaSouth Asia (IDA & IBRD)South SudanSpainSri LankaSt. Kitts and NevisSt. LuciaSt. Vincent and the GrenadinesSub-Saharan Africa Sub-Saharan Africa (excluding high income)Sub-Saharan Africa (IDA & IBRD countries)SudanSurinameSwazilandSwedenSwitzerlandSyrian Arab RepublicTajikistanTanzaniaThailandTimor-LesteTogoTongaTrinidad and TobagoTunisiaTurkeyTurkmenistanUgandaUkraineUnited Arab EmiratesUnited KingdomUnited StatesUpper middle incomeUruguayUzbekistanVanuatuVenezuela, RBVietnamWest Bank and GazaWorldYemen, Rep.ZambiaZimbabwe línea de tiempo (timeline):
En esta escala de tiempo se presenta un gráfico de 1971 y 2016 de Malta. Los datos de 1970 están ausentes. El número de observaciones reales por fecha: 46.
Fuente (nombre):
Indicadores del desarrollo mundial
Fuente (organización):
World Bank national accounts data, and OECD National Accounts data files.
Categorías:
Economy & Growth, Trade
Se ha actualizado:
23 abr 2017 año
Los indicadores de los cambios de valor en los últimos años
Mínimo:
-27.178
1 ene 1971 año
Máximo:
7.87
1 ene 2015 año
A la fecha de observación
Valor
Cambio absoluto
El cambio con respecto al valor anterior
1 ene 1971 año
-27.178
-27.178
0.0%
1 ene 1972 año
-23.428
+3.75
-13.8%
1 ene 1973 año
-20.933
+2.495
-10.65%
1 ene 1974 año
-18.014
+2.919
-13.94%
1 ene 1975 año
-26.439
-8.425
46.77%
1 ene 1976 año
-12.64
+13.799
-52.19%
1 ene 1977 año
-11.077
+1.563
-12.37%
1 ene 1978 año
-13.505
-2.428
21.92%
1 ene 1979 año
-6.979
+6.527
-48.33%
1 ene 1980 año
-5.23
+1.748
-25.05%
1 ene 1981 año
-5.473
-0.243
4.64%
1 ene 1982 año
-8.035
-2.562
46.81%
1 ene 1983 año
-14.962
-6.927
86.21%
1 ene 1984 año
-13.852
+1.109
-7.41%
1 ene 1985 año
-14.058
-0.205
1.48%
1 ene 1986 año
-14.652
-0.595
4.23%
1 ene 1987 año
-9.49
+5.162
-35.23%
1 ene 1988 año
-8.887
+0.602
-6.35%
1 ene 1989 año
-9.508
-0.621
6.98%
1 ene 1990 año
-10.334
-0.826
8.69%
1 ene 1991 año
-12.816
-2.482
24.02%
1 ene 1992 año
-10.494
+2.323
-18.12%
1 ene 1993 año
-6.946
+3.548
-33.81%
1 ene 1994 año
-9.281
-2.335
33.61%
1 ene 1995 año
-9.778
-0.497
5.36%
1 ene 1996 año
-9.431
+0.347
-3.55%
1 ene 1997 año
-9.361
+0.07
-0.74%
1 ene 1998 año
-4.863
+4.498
-48.05%
1 ene 1999 año
-2.633
+2.229
-45.84%
1 ene 2000 año
-2.302
+0.331
-12.57%
1 ene 2001 año
-7.195
-4.892
212.48%
1 ene 2002 año
-1.665
+5.53
-76.86%
1 ene 2003 año
4.397
+6.062
-364.12%
1 ene 2004 año
0.87
-3.527
-80.22%
1 ene 2005 año
-1.329
-2.199
-252.84%
1 ene 2006 año
-2.445
-1.115
83.89%
1 ene 2007 año
-3.375
-0.931
38.08%
1 ene 2008 año
0.564
+3.94
-116.72%
1 ene 2009 año
-0.248
-0.812
-143.94%
1 ene 2010 año
-1.504
-1.256
506.26%
1 ene 2011 año
-0.911
+0.593
-39.43%
1 ene 2012 año
2.736
+3.647
-400.44%
1 ene 2013 año
5.117
+2.381
87.04%
1 ene 2014 año
6.96
+1.842
36.0%
1 ene 2015 año
7.87
+0.91
13.08%
1 ene 2016 año
2.891
-4.979
-63.26%
Ranking de los países por los datos estadísticos actuales


Comentarios: