29
/es/
es
AIzaSyAYiBZKx7MnpbEhh9jyipgxe19OcubqV5w
April 1, 2024
190172
Mali
MLI
true
2
1
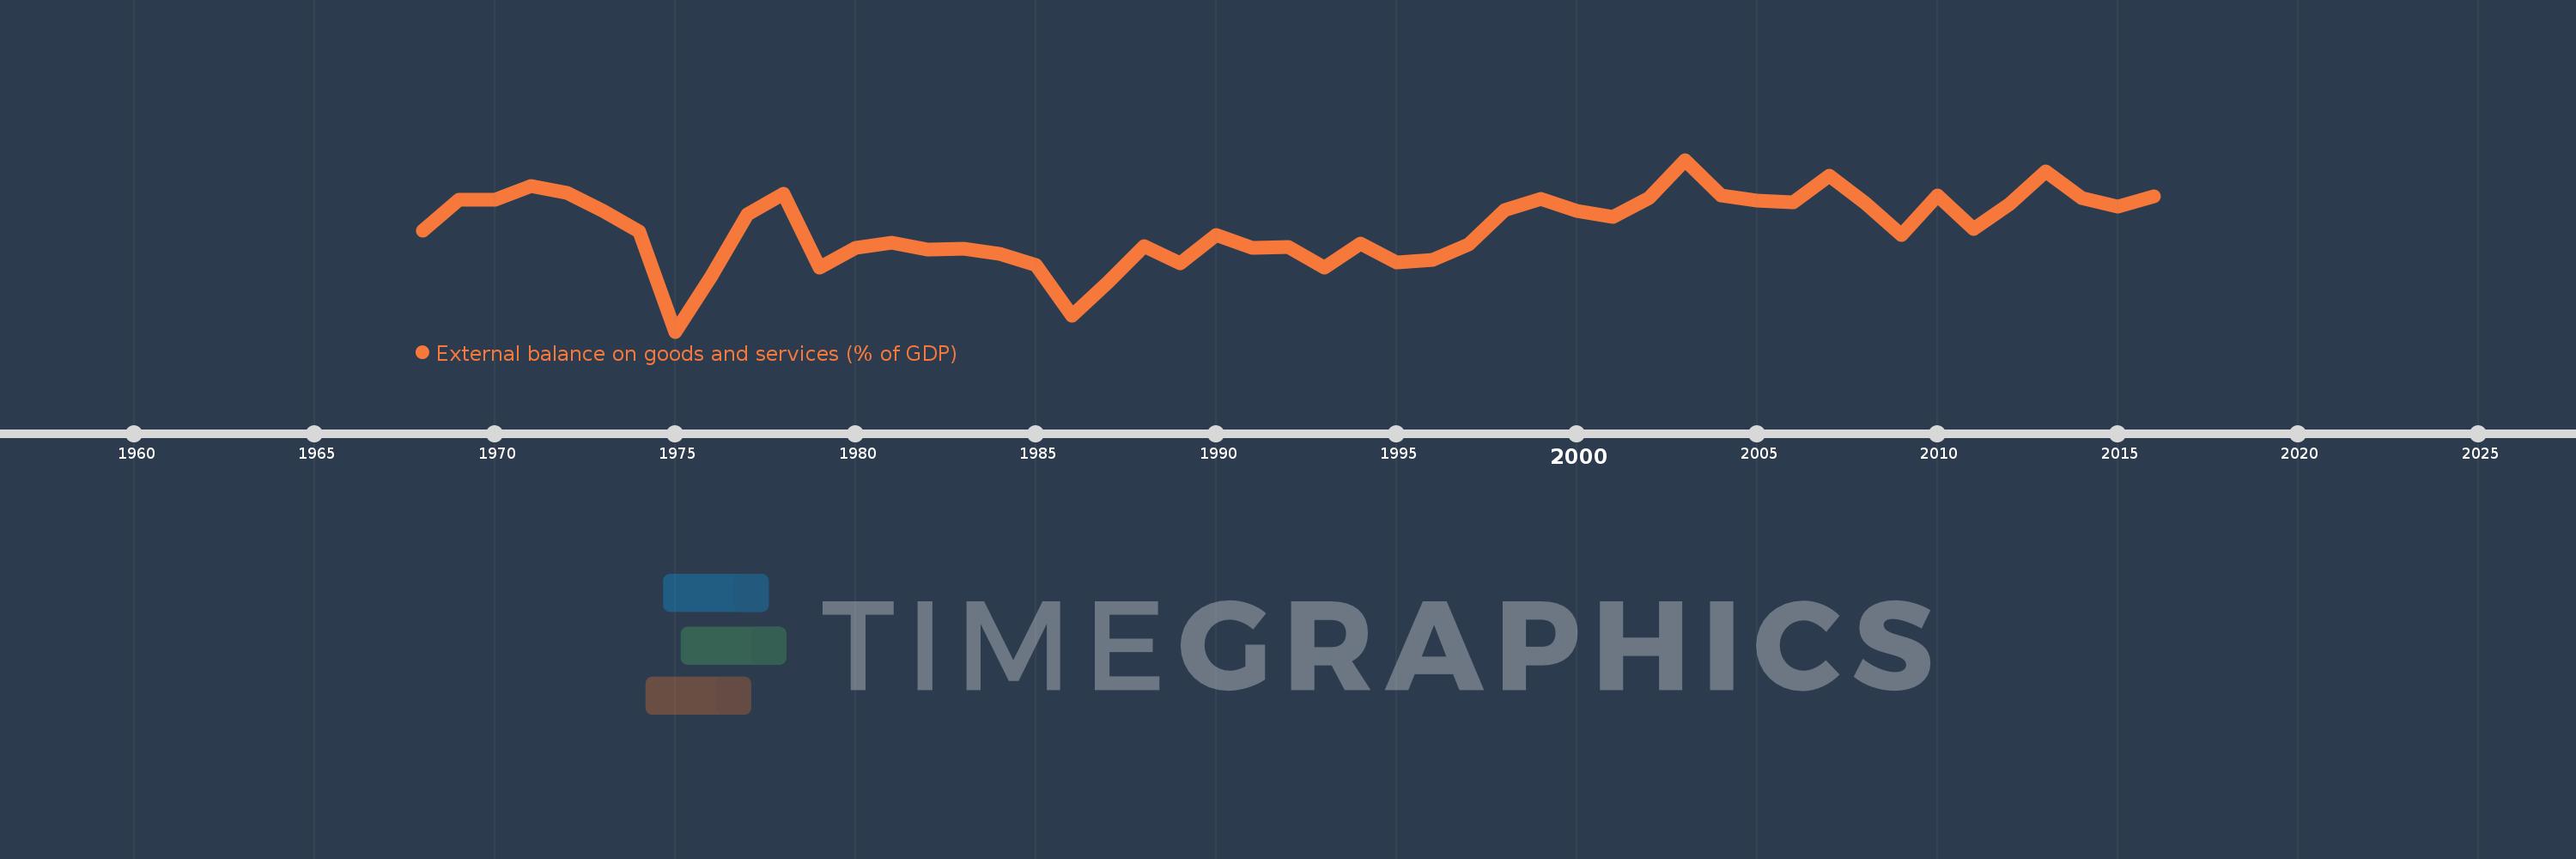
External balance on goods and services (% of GDP)
2016,2015,2014,2013,2012,2011,2010,2009,2008,2007,2006,2005,2004,2003,2002,2001,2000,1999,1998,1997,1996,1995,1994,1993,1992,1991,1990,1989,1988,1987,1986,1985,1984,1983,1982,1981,1980,1979,1978,1977,1976,1975,1974,1973,1972,1971,1970,1969,1968
Estas estadísticas en otros países:
AfghanistanAlbaniaAlgeriaAngolaAntigua and BarbudaArab WorldArgentinaArmeniaArubaAustraliaAustriaAzerbaijanBahamas, TheBahrainBangladeshBarbadosBelarusBelgiumBelizeBeninBermudaBhutanBoliviaBosnia and HerzegovinaBotswanaBrazilBrunei DarussalamBulgariaBurkina FasoBurundiCabo VerdeCambodiaCameroonCanadaCaribbean small statesCentral African RepublicCentral Europe and the BalticsChadChileChinaColombiaComorosCongo, Dem. Rep.Congo, Rep.Costa RicaCote d'IvoireCroatiaCubaCyprusCzech RepublicDenmarkDjiboutiDominicaDominican RepublicEarly-demographic dividendEast Asia & PacificEast Asia & Pacific (excluding high income)East Asia & Pacific (IDA & IBRD countries)EcuadorEgypt, Arab Rep.El SalvadorEquatorial GuineaEritreaEstoniaEthiopiaEuro areaEurope & Central AsiaEurope & Central Asia (excluding high income)Europe & Central Asia (IDA & IBRD countries)European UnionFaroe IslandsFijiFinlandFragile and conflict affected situationsFranceFrench PolynesiaGabonGambia, TheGeorgiaGermanyGhanaGreeceGrenadaGuatemalaGuineaGuinea-BissauGuyanaHaitiHeavily indebted poor countries (HIPC)High incomeHondurasHong Kong SAR, ChinaHungaryIBRD onlyIcelandIDA & IBRD totalIDA blendIDA onlyIDA totalIndiaIndonesiaIran, Islamic Rep.IraqIrelandIsraelItalyJamaicaJapanJordanKazakhstanKenyaKiribatiKorea, Rep.KosovoKuwaitKyrgyz RepublicLao PDRLate-demographic dividendLatin America & Caribbean Latin America & Caribbean (excluding high income)Latin America & the Caribbean (IDA & IBRD countries)LatviaLeast developed countries: UN classificationLebanonLesothoLiberiaLibyaLithuaniaLow & middle incomeLow incomeLower middle incomeLuxembourgMacao SAR, ChinaMacedonia, FYRMadagascarMalawiMalaysiaMaldivesMaliMaltaMauritaniaMauritiusMexicoMicronesia, Fed. Sts.Middle East & North AfricaMiddle East & North Africa (excluding high income)Middle East & North Africa (IDA & IBRD countries)Middle incomeMoldovaMongoliaMontenegroMoroccoMozambiqueMyanmarNamibiaNepalNetherlandsNew CaledoniaNew ZealandNicaraguaNigerNigeriaNorth AmericaNorwayOECD membersOmanOther small statesPacific island small statesPakistanPalauPanamaPapua New GuineaParaguayPeruPhilippinesPolandPortugalPost-demographic dividendPre-demographic dividendPuerto RicoQatarRomaniaRussian FederationRwandaSamoaSaudi ArabiaSenegalSerbiaSeychellesSierra LeoneSingaporeSlovak RepublicSloveniaSmall statesSolomon IslandsSomaliaSouth AfricaSouth AsiaSouth Asia (IDA & IBRD)South SudanSpainSri LankaSt. Kitts and NevisSt. LuciaSt. Vincent and the GrenadinesSub-Saharan Africa Sub-Saharan Africa (excluding high income)Sub-Saharan Africa (IDA & IBRD countries)SudanSurinameSwazilandSwedenSwitzerlandSyrian Arab RepublicTajikistanTanzaniaThailandTimor-LesteTogoTongaTrinidad and TobagoTunisiaTurkeyTurkmenistanUgandaUkraineUnited Arab EmiratesUnited KingdomUnited StatesUpper middle incomeUruguayUzbekistanVanuatuVenezuela, RBVietnamWest Bank and GazaWorldYemen, Rep.ZambiaZimbabwe línea de tiempo (timeline):
En esta escala de tiempo se presenta un gráfico de 1968 y 2016 de Mali. Los datos de 1967 están ausentes. El número de observaciones reales por fecha: 49.
Fuente (nombre):
Indicadores del desarrollo mundial
Fuente (organización):
World Bank national accounts data, and OECD National Accounts data files.
Categorías:
Economy & Growth, Trade
Se ha actualizado:
23 abr 2017 año
Los indicadores de los cambios de valor en los últimos años
Mínimo:
-28.146
1 ene 1975 año
Máximo:
-1.654
1 ene 2003 año
A la fecha de observación
Valor
Cambio absoluto
El cambio con respecto al valor anterior
1 ene 1968 año
-12.542
-12.542
0.0%
1 ene 1969 año
-7.873
+4.67
-37.23%
1 ene 1970 año
-7.809
+0.064
-0.81%
1 ene 1971 año
-5.732
+2.077
-26.59%
1 ene 1972 año
-6.8
-1.068
18.63%
1 ene 1973 año
-9.54
-2.74
40.3%
1 ene 1974 año
-12.655
-3.115
32.65%
1 ene 1975 año
-28.146
-15.491
122.41%
1 ene 1976 año
-19.603
+8.543
-30.35%
1 ene 1977 año
-10.025
+9.578
-48.86%
1 ene 1978 año
-6.824
+3.202
-31.94%
1 ene 1979 año
-18.231
-11.407
167.17%
1 ene 1980 año
-15.234
+2.997
-16.44%
1 ene 1981 año
-14.417
+0.817
-5.36%
1 ene 1982 año
-15.503
-1.086
7.53%
1 ene 1983 año
-15.378
+0.125
-0.81%
1 ene 1984 año
-16.157
-0.778
5.06%
1 ene 1985 año
-17.815
-1.658
10.26%
1 ene 1986 año
-25.702
-7.887
44.27%
1 ene 1987 año
-20.467
+5.235
-20.37%
1 ene 1988 año
-14.933
+5.534
-27.04%
1 ene 1989 año
-17.665
-2.732
18.3%
1 ene 1990 año
-13.195
+4.47
-25.31%
1 ene 1991 año
-15.277
-2.082
15.78%
1 ene 1992 año
-15.044
+0.233
-1.52%
1 ene 1993 año
-18.244
-3.199
21.27%
1 ene 1994 año
-14.539
+3.705
-20.31%
1 ene 1995 año
-17.549
-3.01
20.7%
1 ene 1996 año
-17.122
+0.427
-2.43%
1 ene 1997 año
-14.751
+2.371
-13.85%
1 ene 1998 año
-9.384
+5.367
-36.38%
1 ene 1999 año
-7.67
+1.714
-18.26%
1 ene 2000 año
-9.524
-1.854
24.17%
1 ene 2001 año
-10.465
-0.941
9.88%
1 ene 2002 año
-7.576
+2.889
-27.61%
1 ene 2003 año
-1.654
+5.922
-78.16%
1 ene 2004 año
-7.089
-5.435
328.53%
1 ene 2005 año
-7.957
-0.868
12.24%
1 ene 2006 año
-8.148
-0.19
2.39%
1 ene 2007 año
-4.119
+4.029
-49.45%
1 ene 2008 año
-8.346
-4.227
102.62%
1 ene 2009 año
-13.252
-4.907
58.8%
1 ene 2010 año
-7.099
+6.153
-46.43%
1 ene 2011 año
-12.311
-5.211
73.41%
1 ene 2012 año
-8.461
+3.85
-31.27%
1 ene 2013 año
-3.408
+5.053
-59.72%
1 ene 2014 año
-7.527
-4.119
120.88%
1 ene 2015 año
-8.904
-1.377
18.29%
1 ene 2016 año
-7.285
+1.619
-18.18%
Ranking de los países por los datos estadísticos actuales


Comentarios: