29
/es/
es
AIzaSyAYiBZKx7MnpbEhh9jyipgxe19OcubqV5w
April 1, 2024
202855
Mozambique
MOZ
true
2
1
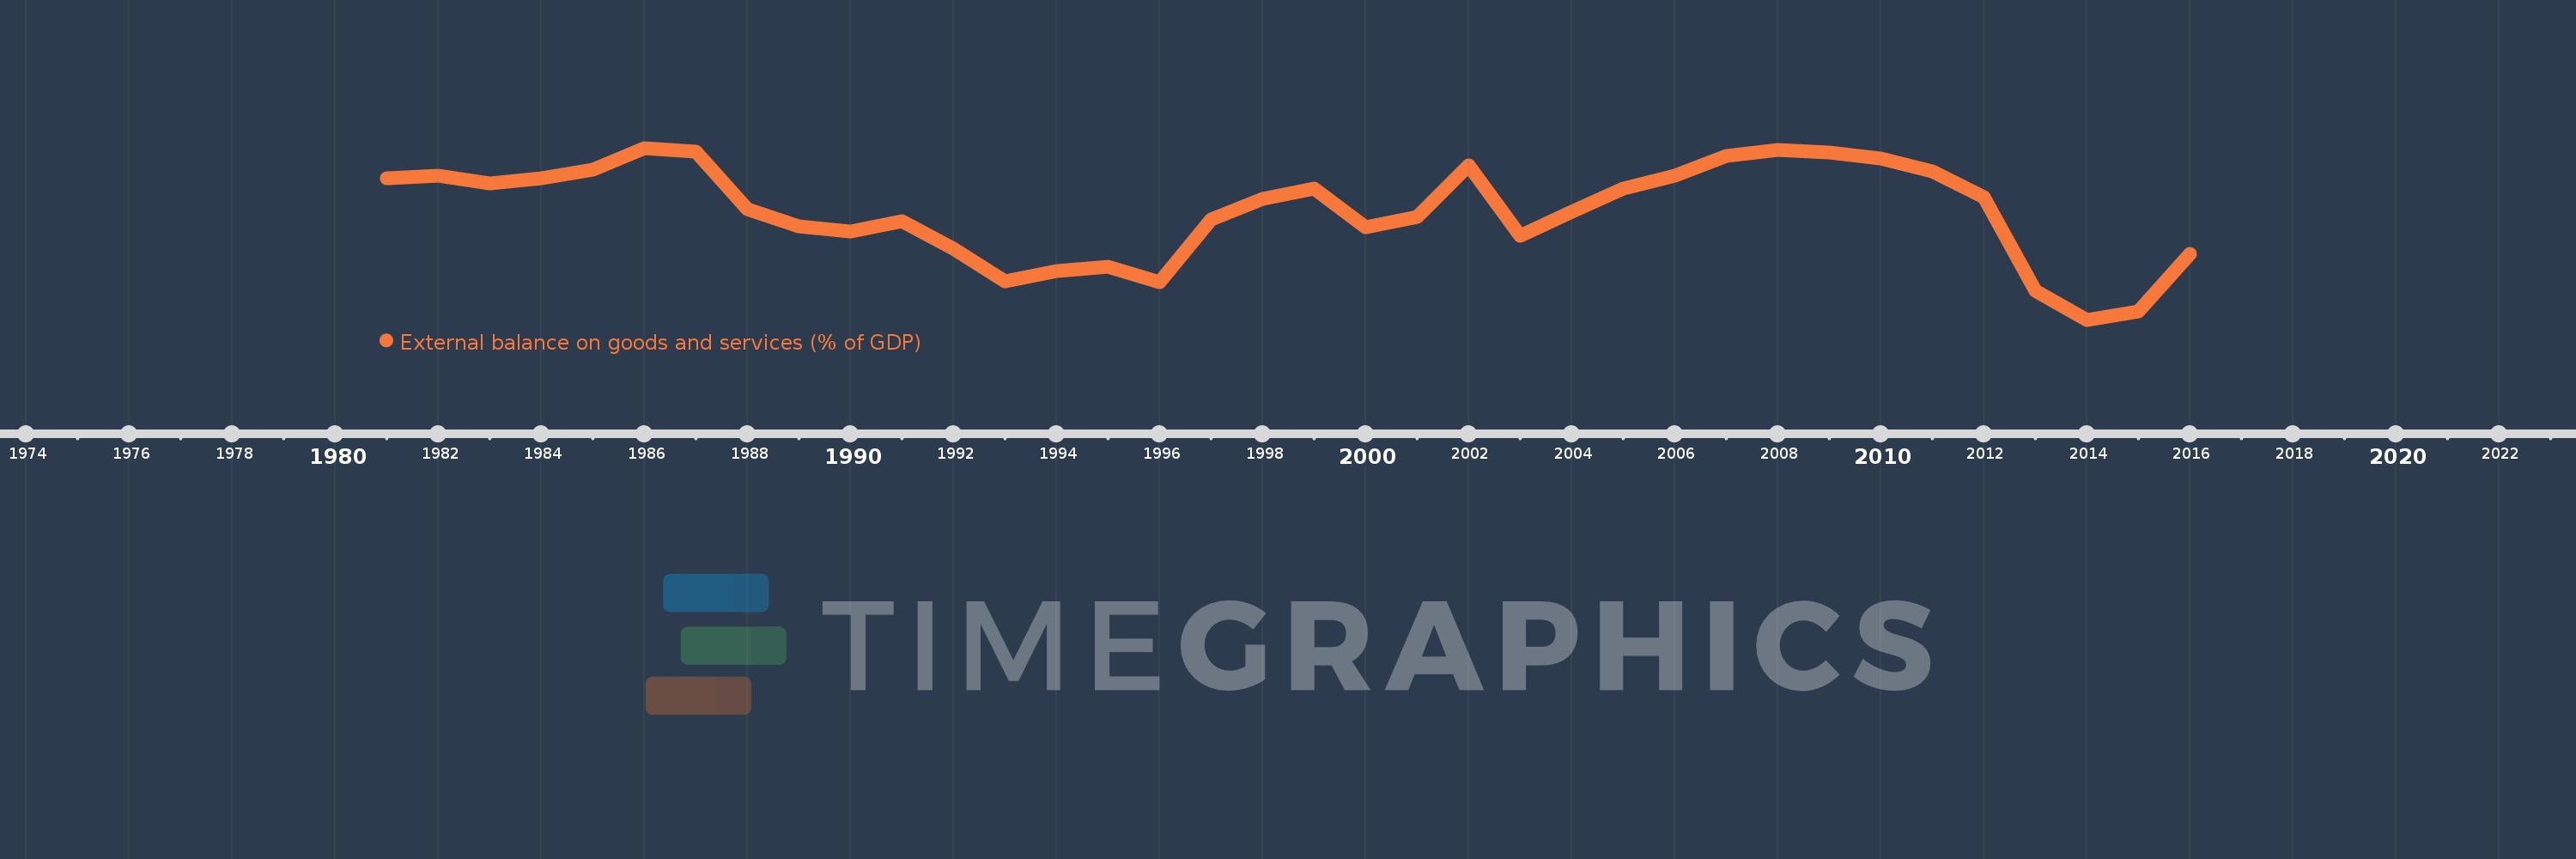
External balance on goods and services (% of GDP)
2016,2015,2014,2013,2012,2011,2010,2009,2008,2007,2006,2005,2004,2003,2002,2001,2000,1999,1998,1997,1996,1995,1994,1993,1992,1991,1990,1989,1988,1987,1986,1985,1984,1983,1982,1981
Estas estadísticas en otros países:
AfghanistanAlbaniaAlgeriaAngolaAntigua and BarbudaArab WorldArgentinaArmeniaArubaAustraliaAustriaAzerbaijanBahamas, TheBahrainBangladeshBarbadosBelarusBelgiumBelizeBeninBermudaBhutanBoliviaBosnia and HerzegovinaBotswanaBrazilBrunei DarussalamBulgariaBurkina FasoBurundiCabo VerdeCambodiaCameroonCanadaCaribbean small statesCentral African RepublicCentral Europe and the BalticsChadChileChinaColombiaComorosCongo, Dem. Rep.Congo, Rep.Costa RicaCote d'IvoireCroatiaCubaCyprusCzech RepublicDenmarkDjiboutiDominicaDominican RepublicEarly-demographic dividendEast Asia & PacificEast Asia & Pacific (excluding high income)East Asia & Pacific (IDA & IBRD countries)EcuadorEgypt, Arab Rep.El SalvadorEquatorial GuineaEritreaEstoniaEthiopiaEuro areaEurope & Central AsiaEurope & Central Asia (excluding high income)Europe & Central Asia (IDA & IBRD countries)European UnionFaroe IslandsFijiFinlandFragile and conflict affected situationsFranceFrench PolynesiaGabonGambia, TheGeorgiaGermanyGhanaGreeceGrenadaGuatemalaGuineaGuinea-BissauGuyanaHaitiHeavily indebted poor countries (HIPC)High incomeHondurasHong Kong SAR, ChinaHungaryIBRD onlyIcelandIDA & IBRD totalIDA blendIDA onlyIDA totalIndiaIndonesiaIran, Islamic Rep.IraqIrelandIsraelItalyJamaicaJapanJordanKazakhstanKenyaKiribatiKorea, Rep.KosovoKuwaitKyrgyz RepublicLao PDRLate-demographic dividendLatin America & Caribbean Latin America & Caribbean (excluding high income)Latin America & the Caribbean (IDA & IBRD countries)LatviaLeast developed countries: UN classificationLebanonLesothoLiberiaLibyaLithuaniaLow & middle incomeLow incomeLower middle incomeLuxembourgMacao SAR, ChinaMacedonia, FYRMadagascarMalawiMalaysiaMaldivesMaliMaltaMauritaniaMauritiusMexicoMicronesia, Fed. Sts.Middle East & North AfricaMiddle East & North Africa (excluding high income)Middle East & North Africa (IDA & IBRD countries)Middle incomeMoldovaMongoliaMontenegroMoroccoMozambiqueMyanmarNamibiaNepalNetherlandsNew CaledoniaNew ZealandNicaraguaNigerNigeriaNorth AmericaNorwayOECD membersOmanOther small statesPacific island small statesPakistanPalauPanamaPapua New GuineaParaguayPeruPhilippinesPolandPortugalPost-demographic dividendPre-demographic dividendPuerto RicoQatarRomaniaRussian FederationRwandaSamoaSaudi ArabiaSenegalSerbiaSeychellesSierra LeoneSingaporeSlovak RepublicSloveniaSmall statesSolomon IslandsSomaliaSouth AfricaSouth AsiaSouth Asia (IDA & IBRD)South SudanSpainSri LankaSt. Kitts and NevisSt. LuciaSt. Vincent and the GrenadinesSub-Saharan Africa Sub-Saharan Africa (excluding high income)Sub-Saharan Africa (IDA & IBRD countries)SudanSurinameSwazilandSwedenSwitzerlandSyrian Arab RepublicTajikistanTanzaniaThailandTimor-LesteTogoTongaTrinidad and TobagoTunisiaTurkeyTurkmenistanUgandaUkraineUnited Arab EmiratesUnited KingdomUnited StatesUpper middle incomeUruguayUzbekistanVanuatuVenezuela, RBVietnamWest Bank and GazaWorldYemen, Rep.ZambiaZimbabwe línea de tiempo (timeline):
En esta escala de tiempo se presenta un gráfico de 1981 y 2016 de Mozambique. Los datos de 1980 están ausentes. El número de observaciones reales por fecha: 36.
Fuente (nombre):
Indicadores del desarrollo mundial
Fuente (organización):
World Bank national accounts data, and OECD National Accounts data files.
Categorías:
Economy & Growth, Trade
Se ha actualizado:
23 abr 2017 año
Los indicadores de los cambios de valor en los últimos años
Mínimo:
-53.637
1 ene 2014 año
Máximo:
-8.607
1 ene 1986 año
A la fecha de observación
Valor
Cambio absoluto
El cambio con respecto al valor anterior
1 ene 1981 año
-16.497
-16.497
0.0%
1 ene 1982 año
-15.805
+0.693
-4.2%
1 ene 1983 año
-17.901
-2.096
13.26%
1 ene 1984 año
-16.646
+1.254
-7.01%
1 ene 1985 año
-14.214
+2.432
-14.61%
1 ene 1986 año
-8.607
+5.608
-39.45%
1 ene 1987 año
-9.502
-0.895
10.4%
1 ene 1988 año
-24.744
-15.242
160.42%
1 ene 1989 año
-29.227
-4.483
18.12%
1 ene 1990 año
-30.425
-1.199
4.1%
1 ene 1991 año
-27.894
+2.531
-8.32%
1 ene 1992 año
-34.98
-7.086
25.4%
1 ene 1993 año
-43.58
-8.599
24.58%
1 ene 1994 año
-40.845
+2.735
-6.28%
1 ene 1995 año
-39.759
+1.086
-2.66%
1 ene 1996 año
-43.705
-3.946
9.93%
1 ene 1997 año
-27.37
+16.336
-37.38%
1 ene 1998 año
-22.07
+5.3
-19.36%
1 ene 1999 año
-19.27
+2.801
-12.69%
1 ene 2000 año
-29.355
-10.085
52.33%
1 ene 2001 año
-26.733
+2.622
-8.93%
1 ene 2002 año
-13.183
+13.549
-50.68%
1 ene 2003 año
-31.595
-18.412
139.66%
1 ene 2004 año
-25.381
+6.214
-19.67%
1 ene 2005 año
-19.355
+6.026
-23.74%
1 ene 2006 año
-15.987
+3.368
-17.4%
1 ene 2007 año
-10.768
+5.219
-32.64%
1 ene 2008 año
-9.075
+1.693
-15.72%
1 ene 2009 año
-9.836
-0.761
8.39%
1 ene 2010 año
-11.308
-1.471
14.96%
1 ene 2011 año
-14.711
-3.403
30.1%
1 ene 2012 año
-21.481
-6.77
46.02%
1 ene 2013 año
-46.078
-24.596
114.5%
1 ene 2014 año
-53.637
-7.56
16.41%
1 ene 2015 año
-51.404
+2.233
-4.16%
1 ene 2016 año
-36.328
+15.076
-29.33%
Ranking de los países por los datos estadísticos actuales


Comentarios: