29
/es/
es
AIzaSyAYiBZKx7MnpbEhh9jyipgxe19OcubqV5w
April 1, 2024
33391
European Union
EUU
false
2
1
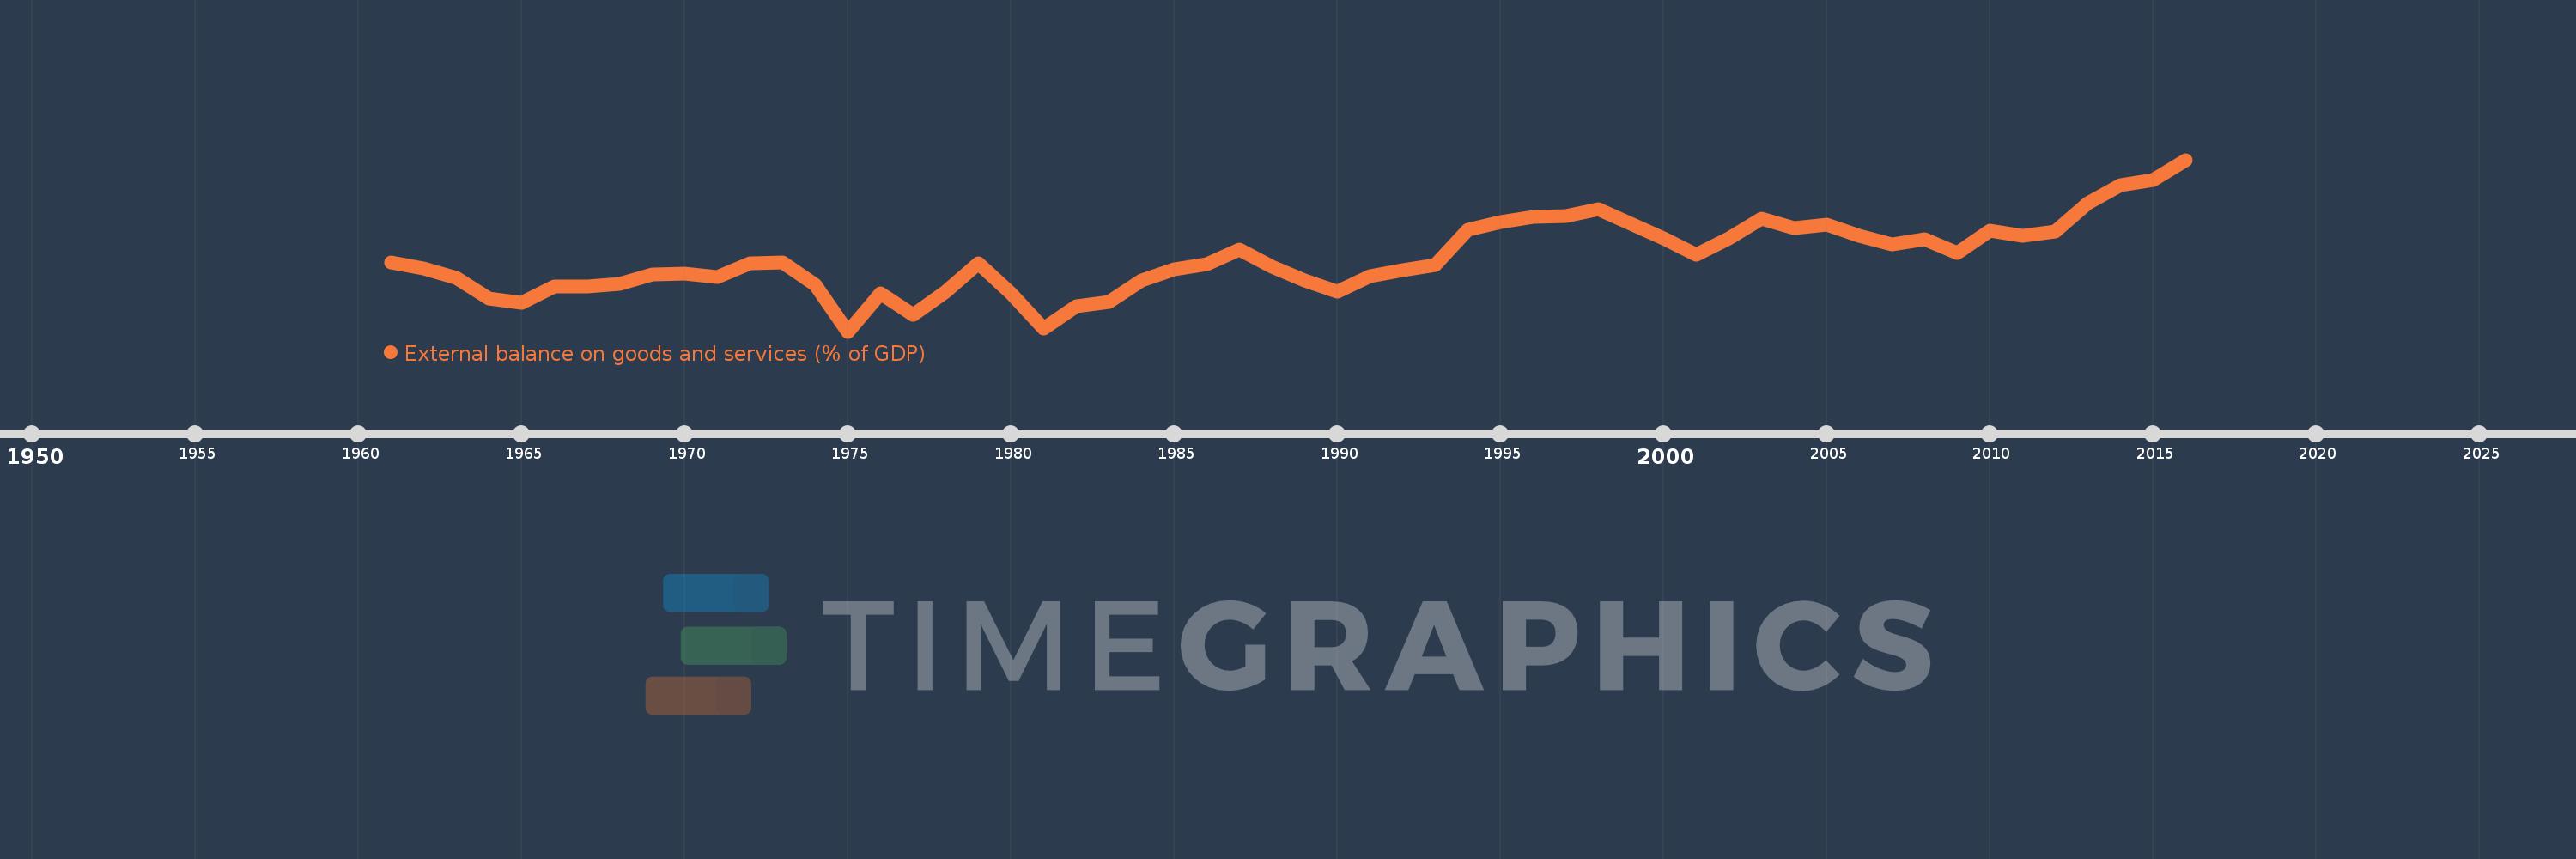
External balance on goods and services (% of GDP)
2016,2015,2014,2013,2012,2011,2010,2009,2008,2007,2006,2005,2004,2003,2002,2001,2000,1999,1998,1997,1996,1995,1994,1993,1992,1991,1990,1989,1988,1987,1986,1985,1984,1983,1982,1981,1980,1979,1978,1977,1976,1975,1974,1973,1972,1971,1970,1969,1968,1967,1966,1965,1964,1963,1962,1961
Estas estadísticas en otros países:
AfghanistanAlbaniaAlgeriaAngolaAntigua and BarbudaArab WorldArgentinaArmeniaArubaAustraliaAustriaAzerbaijanBahamas, TheBahrainBangladeshBarbadosBelarusBelgiumBelizeBeninBermudaBhutanBoliviaBosnia and HerzegovinaBotswanaBrazilBrunei DarussalamBulgariaBurkina FasoBurundiCabo VerdeCambodiaCameroonCanadaCaribbean small statesCentral African RepublicCentral Europe and the BalticsChadChileChinaColombiaComorosCongo, Dem. Rep.Congo, Rep.Costa RicaCote d'IvoireCroatiaCubaCyprusCzech RepublicDenmarkDjiboutiDominicaDominican RepublicEarly-demographic dividendEast Asia & PacificEast Asia & Pacific (excluding high income)East Asia & Pacific (IDA & IBRD countries)EcuadorEgypt, Arab Rep.El SalvadorEquatorial GuineaEritreaEstoniaEthiopiaEuro areaEurope & Central AsiaEurope & Central Asia (excluding high income)Europe & Central Asia (IDA & IBRD countries)European UnionFaroe IslandsFijiFinlandFragile and conflict affected situationsFranceFrench PolynesiaGabonGambia, TheGeorgiaGermanyGhanaGreeceGrenadaGuatemalaGuineaGuinea-BissauGuyanaHaitiHeavily indebted poor countries (HIPC)High incomeHondurasHong Kong SAR, ChinaHungaryIBRD onlyIcelandIDA & IBRD totalIDA blendIDA onlyIDA totalIndiaIndonesiaIran, Islamic Rep.IraqIrelandIsraelItalyJamaicaJapanJordanKazakhstanKenyaKiribatiKorea, Rep.KosovoKuwaitKyrgyz RepublicLao PDRLate-demographic dividendLatin America & Caribbean Latin America & Caribbean (excluding high income)Latin America & the Caribbean (IDA & IBRD countries)LatviaLeast developed countries: UN classificationLebanonLesothoLiberiaLibyaLithuaniaLow & middle incomeLow incomeLower middle incomeLuxembourgMacao SAR, ChinaMacedonia, FYRMadagascarMalawiMalaysiaMaldivesMaliMaltaMauritaniaMauritiusMexicoMicronesia, Fed. Sts.Middle East & North AfricaMiddle East & North Africa (excluding high income)Middle East & North Africa (IDA & IBRD countries)Middle incomeMoldovaMongoliaMontenegroMoroccoMozambiqueMyanmarNamibiaNepalNetherlandsNew CaledoniaNew ZealandNicaraguaNigerNigeriaNorth AmericaNorwayOECD membersOmanOther small statesPacific island small statesPakistanPalauPanamaPapua New GuineaParaguayPeruPhilippinesPolandPortugalPost-demographic dividendPre-demographic dividendPuerto RicoQatarRomaniaRussian FederationRwandaSamoaSaudi ArabiaSenegalSerbiaSeychellesSierra LeoneSingaporeSlovak RepublicSloveniaSmall statesSolomon IslandsSomaliaSouth AfricaSouth AsiaSouth Asia (IDA & IBRD)South SudanSpainSri LankaSt. Kitts and NevisSt. LuciaSt. Vincent and the GrenadinesSub-Saharan Africa Sub-Saharan Africa (excluding high income)Sub-Saharan Africa (IDA & IBRD countries)SudanSurinameSwazilandSwedenSwitzerlandSyrian Arab RepublicTajikistanTanzaniaThailandTimor-LesteTogoTongaTrinidad and TobagoTunisiaTurkeyTurkmenistanUgandaUkraineUnited Arab EmiratesUnited KingdomUnited StatesUpper middle incomeUruguayUzbekistanVanuatuVenezuela, RBVietnamWest Bank and GazaWorldYemen, Rep.ZambiaZimbabwe línea de tiempo (timeline):
En esta escala de tiempo se presenta un gráfico de 1961 y 2016 de European Union. Los datos de 1960 están ausentes. El número de observaciones reales por fecha: 56.
Fuente (nombre):
Indicadores del desarrollo mundial
Fuente (organización):
World Bank national accounts data, and OECD National Accounts data files.
Categorías:
Economy & Growth, Trade
Se ha actualizado:
23 abr 2017 año
Los indicadores de los cambios de valor en los últimos años
Mínimo:
-2.309
1 ene 1975 año
Máximo:
3.277
1 ene 2016 año
A la fecha de observación
Valor
Cambio absoluto
El cambio con respecto al valor anterior
1 ene 1961 año
-0.057
-0.057
0.0%
1 ene 1962 año
-0.243
-0.187
328.88%
1 ene 1963 año
-0.561
-0.318
130.7%
1 ene 1964 año
-1.22
-0.659
117.38%
1 ene 1965 año
-1.374
-0.153
12.58%
1 ene 1966 año
-0.851
+0.523
-38.06%
1 ene 1967 año
-0.839
+0.012
-1.45%
1 ene 1968 año
-0.771
+0.068
-8.1%
1 ene 1969 año
-0.446
+0.324
-42.07%
1 ene 1970 año
-0.41
+0.036
-8.16%
1 ene 1971 año
-0.525
-0.115
28.02%
1 ene 1972 año
-0.088
+0.437
-83.23%
1 ene 1973 año
-0.065
+0.023
-26.57%
1 ene 1974 año
-0.792
-0.727
1.12 mil%
1 ene 1975 año
-2.309
-1.517
191.58%
1 ene 1976 año
-1.06
+1.248
-54.07%
1 ene 1977 año
-1.758
-0.697
65.76%
1 ene 1978 año
-1.017
+0.741
-42.15%
1 ene 1979 año
-0.082
+0.934
-91.9%
1 ene 1980 año
-1.059
-0.977
1.19 mil%
1 ene 1981 año
-2.2
-1.141
107.72%
1 ene 1982 año
-1.496
+0.704
-32.01%
1 ene 1983 año
-1.335
+0.161
-10.78%
1 ene 1984 año
-0.661
+0.673
-50.44%
1 ene 1985 año
-0.283
+0.378
-57.17%
1 ene 1986 año
-0.103
+0.18
-63.47%
1 ene 1987 año
0.359
+0.462
-446.59%
1 ene 1988 año
-0.208
-0.567
-158.0%
1 ene 1989 año
-0.656
-0.448
215.26%
1 ene 1990 año
-1.017
-0.361
55.09%
1 ene 1991 año
-0.518
+0.499
-49.03%
1 ene 1992 año
-0.311
+0.208
-40.04%
1 ene 1993 año
-0.139
+0.172
-55.4%
1 ene 1994 año
0.997
+1.136
-819.22%
1 ene 1995 año
1.259
+0.262
26.26%
1 ene 1996 año
1.415
+0.156
12.41%
1 ene 1997 año
1.438
+0.023
1.61%
1 ene 1998 año
1.681
+0.243
16.93%
1 ene 1999 año
1.207
-0.474
-28.19%
1 ene 2000 año
0.716
-0.491
-40.67%
1 ene 2001 año
0.203
-0.513
-71.61%
1 ene 2002 año
0.715
+0.512
251.56%
1 ene 2003 año
1.375
+0.66
92.29%
1 ene 2004 año
1.052
-0.323
-23.51%
1 ene 2005 año
1.167
+0.116
11.01%
1 ene 2006 año
0.803
-0.365
-31.23%
1 ene 2007 año
0.53
-0.273
-33.95%
1 ene 2008 año
0.695
+0.165
31.03%
1 ene 2009 año
0.239
-0.455
-65.53%
1 ene 2010 año
0.96
+0.721
301.02%
1 ene 2011 año
0.807
-0.153
-15.94%
1 ene 2012 año
0.942
+0.135
16.72%
1 ene 2013 año
1.855
+0.913
96.86%
1 ene 2014 año
2.466
+0.612
32.98%
1 ene 2015 año
2.623
+0.156
6.34%
1 ene 2016 año
3.277
+0.654
24.93%
Ranking de los países por los datos estadísticos actuales


Comentarios: