29
/es/
es
AIzaSyAYiBZKx7MnpbEhh9jyipgxe19OcubqV5w
April 1, 2024
76550
Bahamas, The
BHS
true
2
1
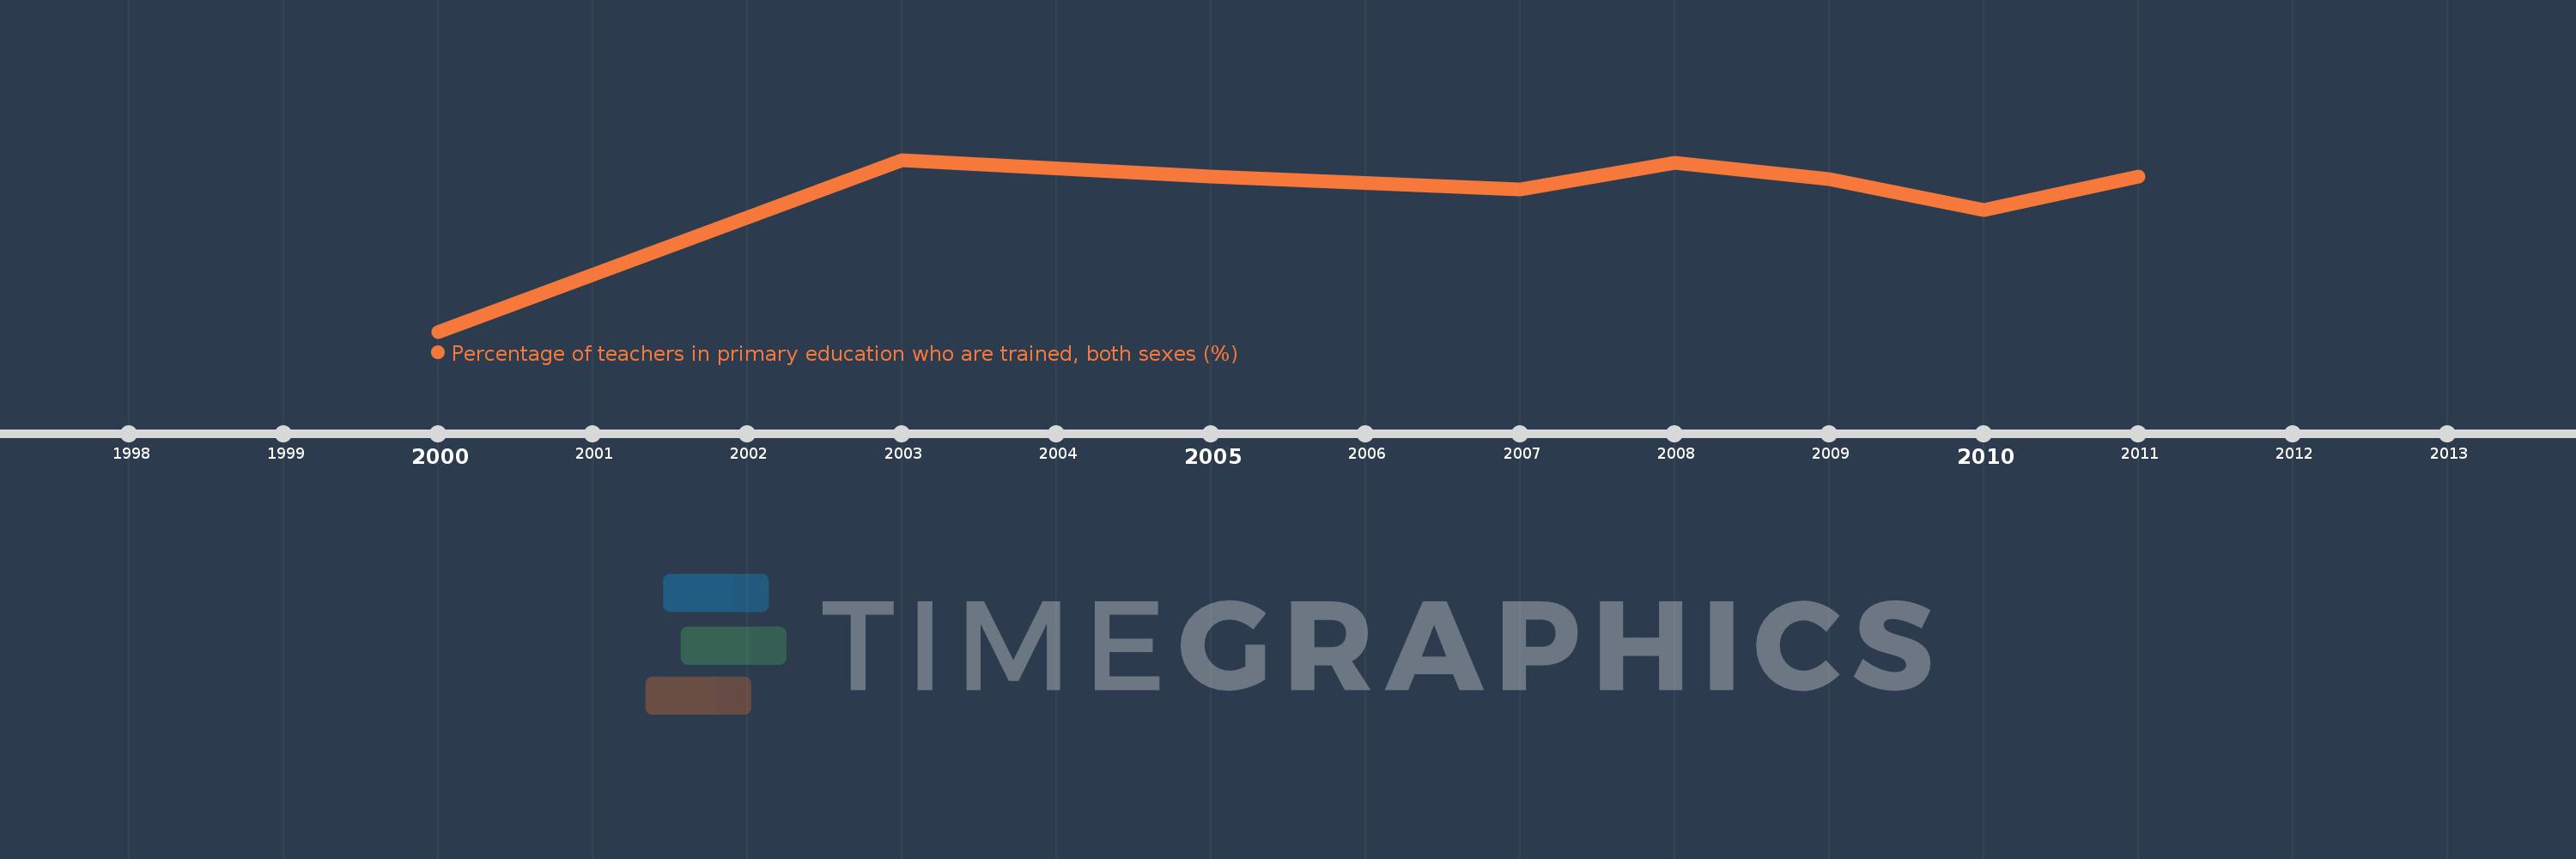
Percentage of teachers in primary education who are trained, both sexes (%)
2011,2010,2009,2008,2007,2005,2003,2000
Estas estadísticas en otros países:
línea de tiempo (timeline):
En esta escala de tiempo se presenta un gráfico de 2000 y 2011 de Bahamas, The. Los datos de 1999 están ausentes. El número de observaciones reales por fecha: 8.
Fuente (nombre):
Indicadores del desarrollo mundial
Fuente (organización):
United Nations Educational, Scientific, and Cultural Organization (UNESCO) Institute for Statistics.
Categorías:
Education
Se ha actualizado:
23 abr 2017 año
Los indicadores de los cambios de valor en los últimos años
Mínimo:
58.437
1 ene 2000 año
Máximo:
95.121
1 ene 2003 año
A la fecha de observación
Valor
Cambio absoluto
El cambio con respecto al valor anterior
1 ene 2000 año
58.437
+58.437
0.0%
1 ene 2003 año
95.121
+36.684
62.77%
1 ene 2005 año
91.535
-3.586
-3.77%
1 ene 2007 año
88.822
-2.713
-2.96%
1 ene 2008 año
94.463
+5.641
6.35%
1 ene 2009 año
91.084
-3.378
-3.58%
1 ene 2010 año
84.42
-6.664
-7.32%
1 ene 2011 año
91.549
+7.128
8.44%
Ranking de los países por los datos estadísticos actuales


Comentarios: