29
/es/
es
AIzaSyAYiBZKx7MnpbEhh9jyipgxe19OcubqV5w
April 1, 2024
140864
Ghana
GHA
true
2
1
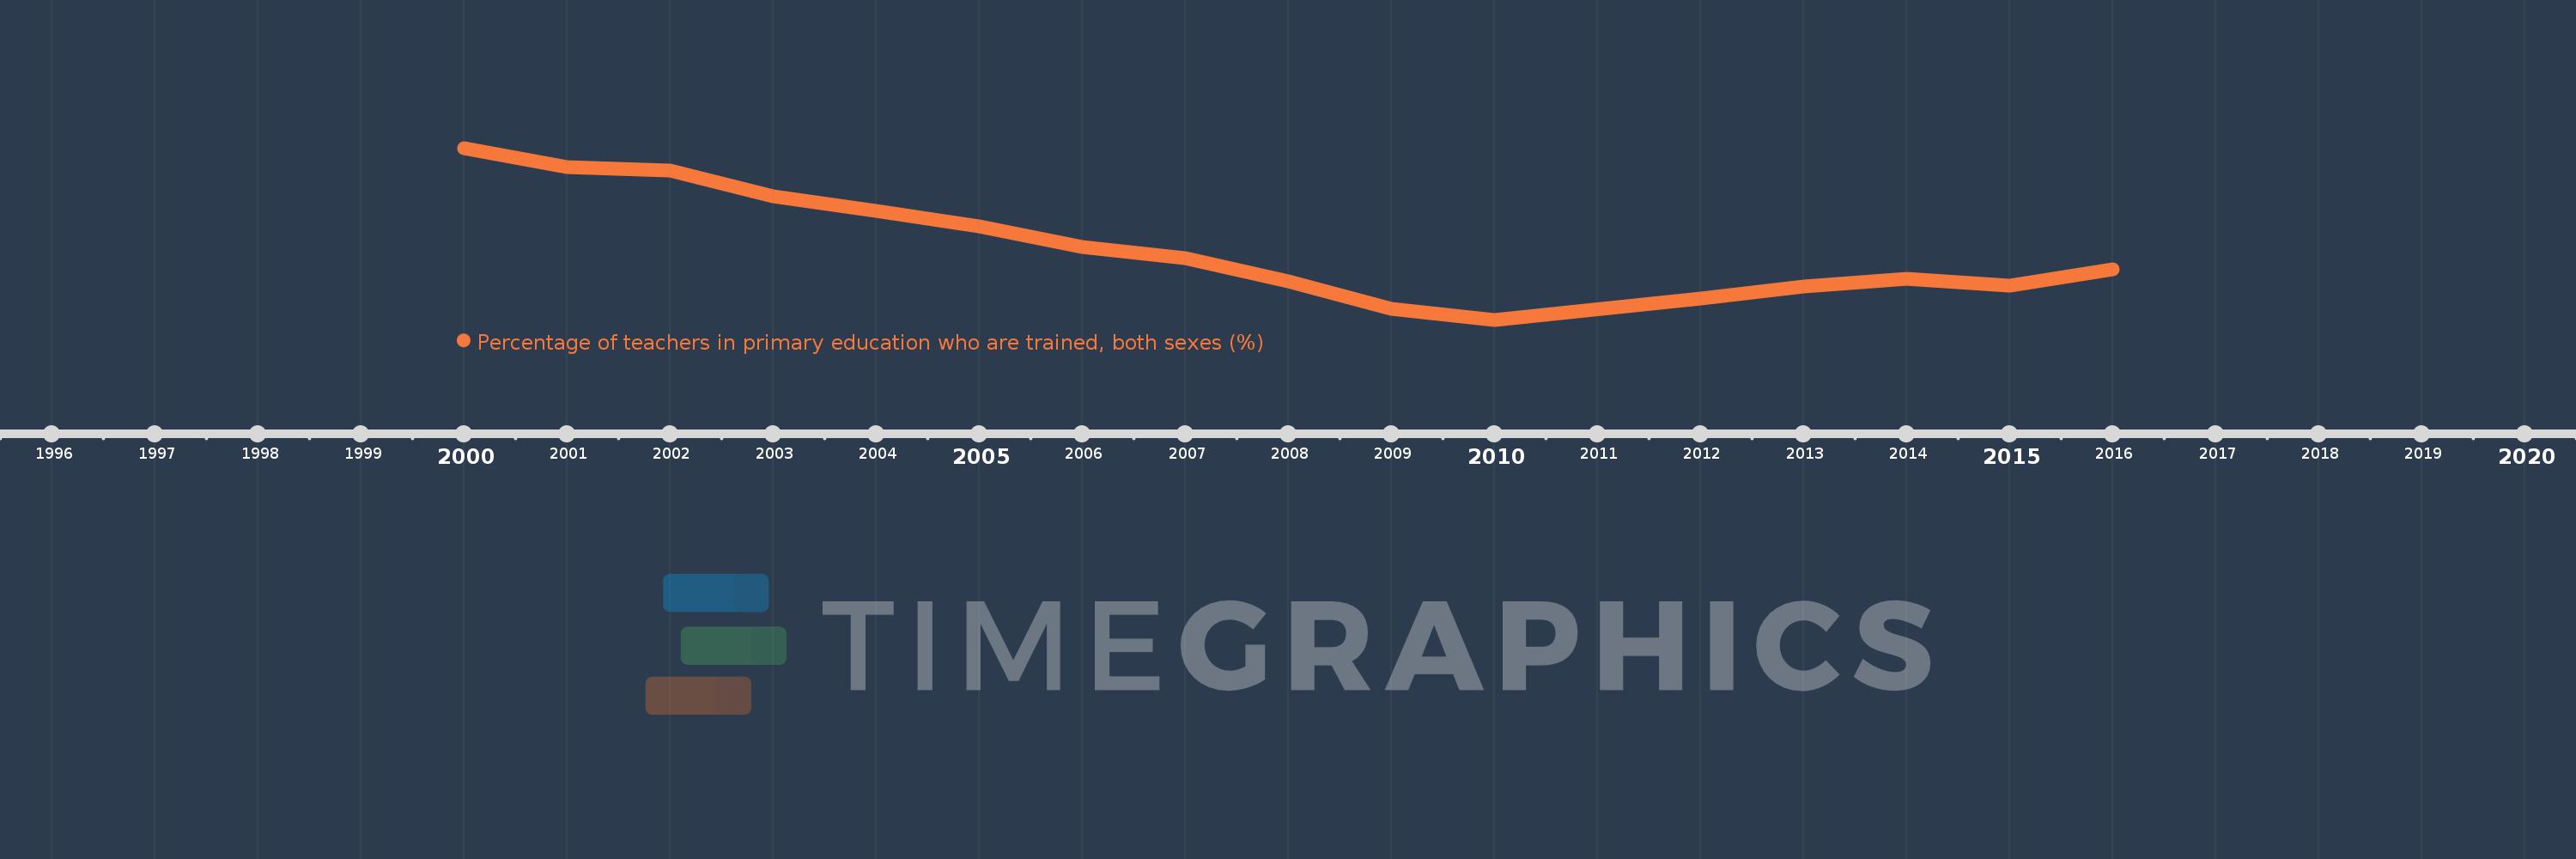
Percentage of teachers in primary education who are trained, both sexes (%)
2016,2015,2014,2013,2012,2010,2009,2008,2007,2006,2005,2004,2003,2002,2001,2000
Estas estadísticas en otros países:
línea de tiempo (timeline):
En esta escala de tiempo se presenta un gráfico de 2000 y 2016 de Ghana. Los datos de 1999 están ausentes. El número de observaciones reales por fecha: 16.
Fuente (nombre):
Indicadores del desarrollo mundial
Fuente (organización):
United Nations Educational, Scientific, and Cultural Organization (UNESCO) Institute for Statistics.
Categorías:
Education
Se ha actualizado:
23 abr 2017 año
Los indicadores de los cambios de valor en los últimos años
Mínimo:
47.567
1 ene 2010 año
Máximo:
71.796
1 ene 2000 año
A la fecha de observación
Valor
Cambio absoluto
El cambio con respecto al valor anterior
1 ene 2000 año
71.796
+71.796
0.0%
1 ene 2001 año
69.093
-2.703
-3.76%
1 ene 2002 año
68.612
-0.481
-0.7%
1 ene 2003 año
64.944
-3.668
-5.35%
1 ene 2004 año
62.88
-2.064
-3.18%
1 ene 2005 año
60.714
-2.167
-3.45%
1 ene 2006 año
57.875
-2.838
-4.67%
1 ene 2007 año
56.304
-1.571
-2.72%
1 ene 2008 año
53.011
-3.293
-5.85%
1 ene 2009 año
49.071
-3.94
-7.43%
1 ene 2010 año
47.567
-1.504
-3.07%
1 ene 2012 año
50.6
+3.034
6.38%
1 ene 2013 año
52.266
+1.666
3.29%
1 ene 2014 año
53.304
+1.039
1.99%
1 ene 2015 año
52.398
-0.907
-1.7%
1 ene 2016 año
54.695
+2.297
4.38%
Ranking de los países por los datos estadísticos actuales


Comentarios: