29
/es/
es
AIzaSyAYiBZKx7MnpbEhh9jyipgxe19OcubqV5w
April 1, 2024
199619
Mongolia
MNG
true
2
1
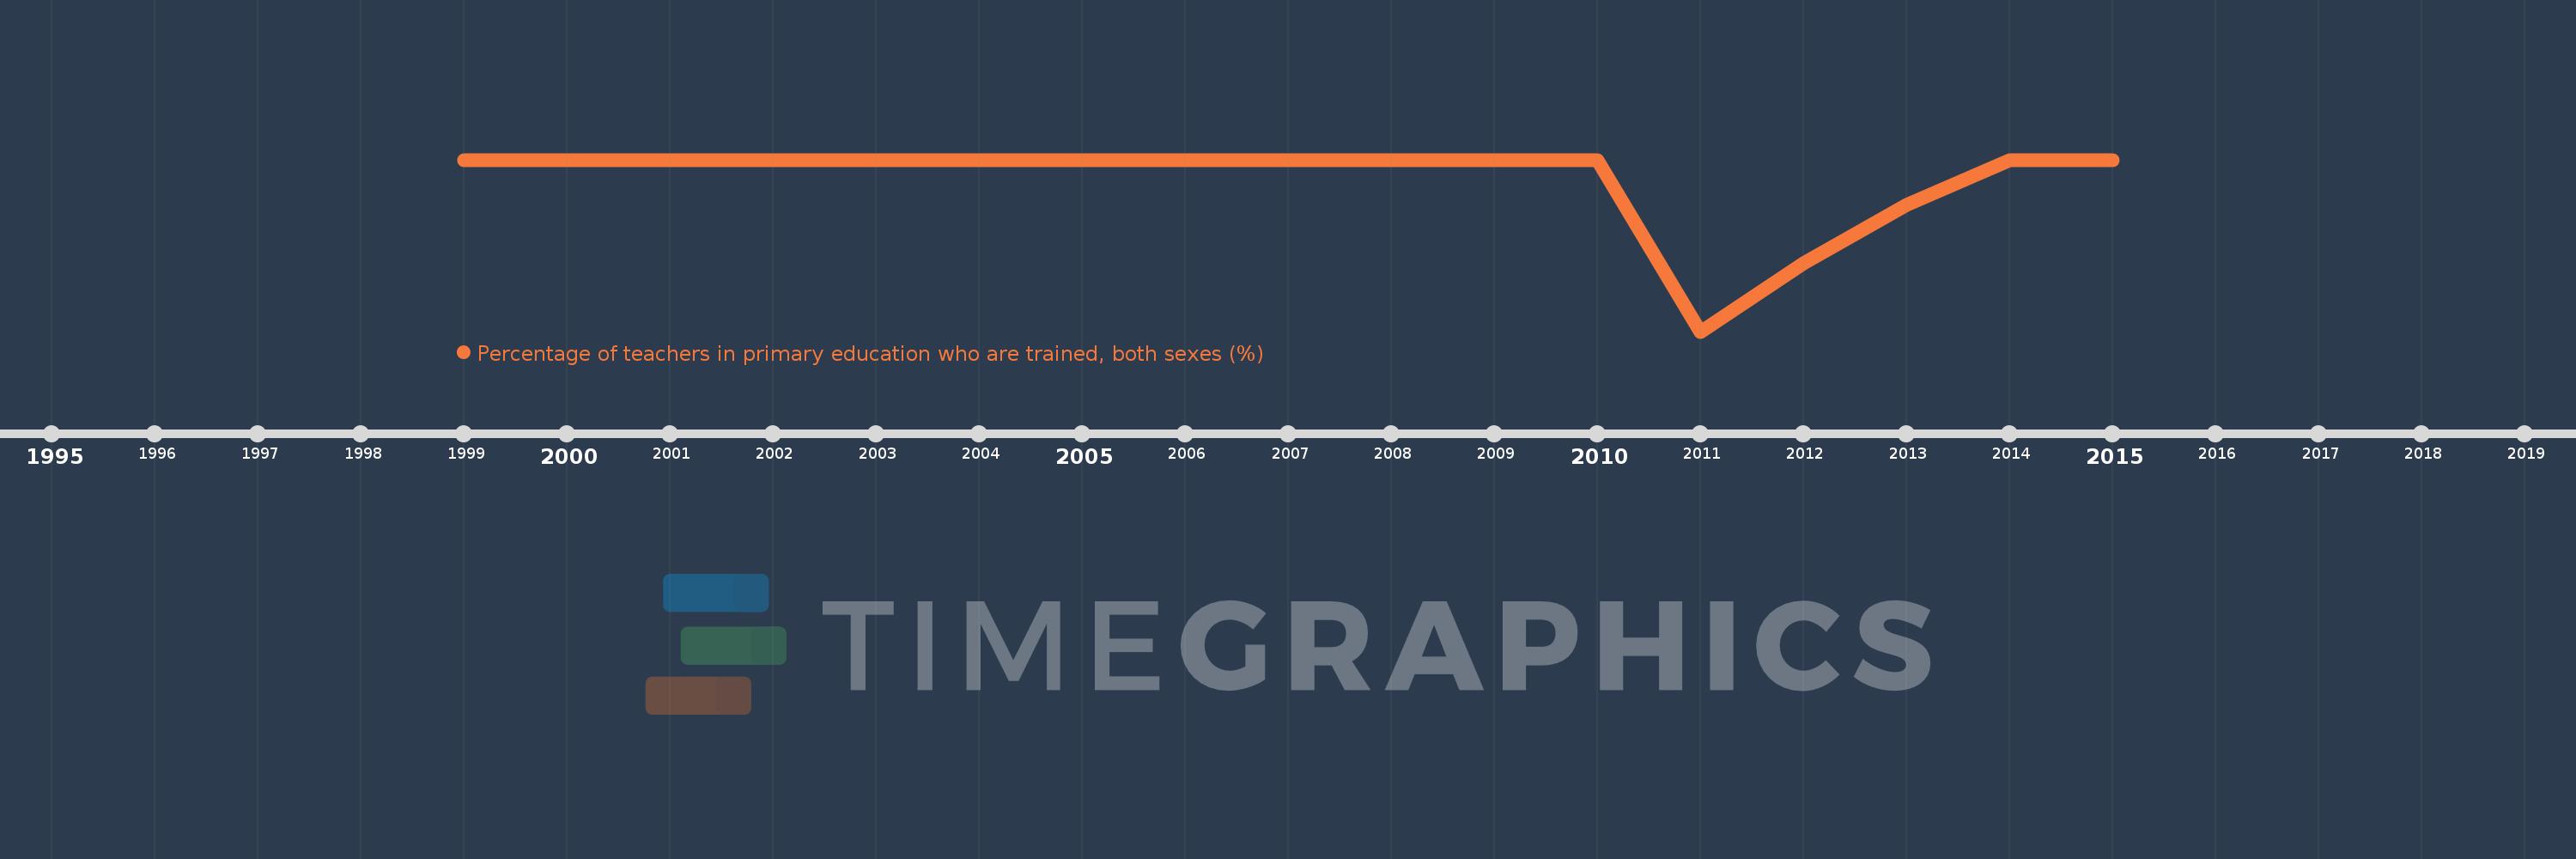
Percentage of teachers in primary education who are trained, both sexes (%)
2015,2014,2013,2012,2011,2010,2009,2008,2007,2006,2005,2004,2003,2002,2001,2000,1999
Estas estadísticas en otros países:
línea de tiempo (timeline):
En esta escala de tiempo se presenta un gráfico de 1999 y 2015 de Mongolia. Los datos de 1998 están ausentes. El número de observaciones reales por fecha: 17.
Fuente (nombre):
Indicadores del desarrollo mundial
Fuente (organización):
United Nations Educational, Scientific, and Cultural Organization (UNESCO) Institute for Statistics.
Categorías:
Education
Se ha actualizado:
23 abr 2017 año
Los indicadores de los cambios de valor en los últimos años
Mínimo:
97.572
1 ene 2011 año
Máximo:
100.0
1 ene 1999 año
A la fecha de observación
Valor
Cambio absoluto
El cambio con respecto al valor anterior
1 ene 1999 año
100.0
+100.0
0.0%
1 ene 2000 año
100.0
0.0
0.0%
1 ene 2001 año
100.0
0.0
0.0%
1 ene 2002 año
100.0
0.0
0.0%
1 ene 2003 año
100.0
0.0
0.0%
1 ene 2004 año
100.0
0.0
0.0%
1 ene 2005 año
100.0
0.0
0.0%
1 ene 2006 año
100.0
0.0
0.0%
1 ene 2007 año
100.0
0.0
0.0%
1 ene 2008 año
100.0
0.0
0.0%
1 ene 2009 año
100.0
0.0
0.0%
1 ene 2010 año
100.0
0.0
0.0%
1 ene 2011 año
97.572
-2.428
-2.43%
1 ene 2012 año
98.543
+0.971
1.0%
1 ene 2013 año
99.361
+0.818
0.83%
1 ene 2014 año
100.0
+0.639
0.64%
1 ene 2015 año
100.0
0.0
0.0%
Ranking de los países por los datos estadísticos actuales


Comentarios: