29
/fr/
fr
AIzaSyAYiBZKx7MnpbEhh9jyipgxe19OcubqV5w
April 1, 2024
76550
Bahamas, The
BHS
true
2
1
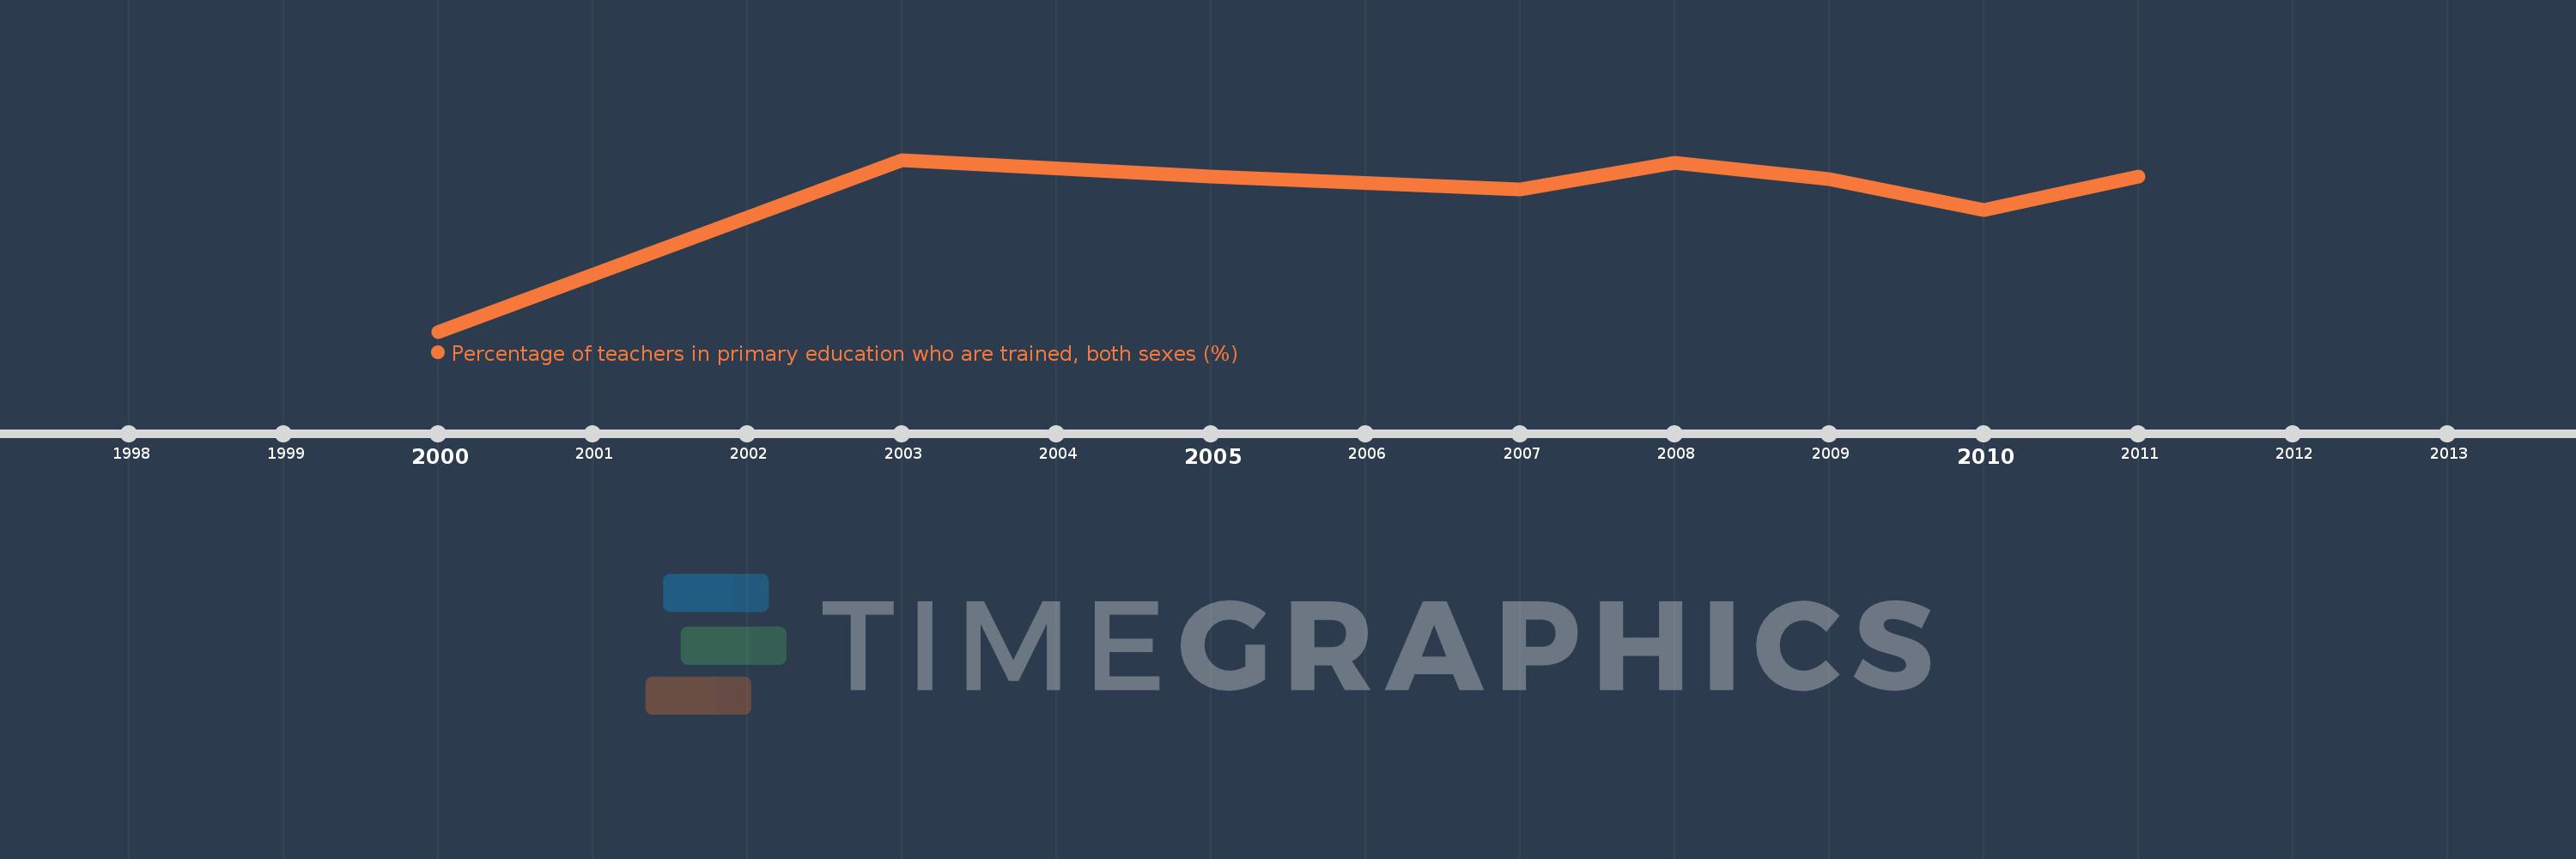
Percentage of teachers in primary education who are trained, both sexes (%)
2011,2010,2009,2008,2007,2005,2003,2000
Cette statistique dans les autres pays:
La ligne de temps
Cette échelle de temps montre un graphique de 2000 année à 2011 année Bahamas, The. Les données jusqu'à 1999 année ne sont pas présentés. Quantité d'observations actuelles selon dates: 8.
Source (désignation):
Les indicateurs du développement mondiale
Source (organisation):
United Nations Educational, Scientific, and Cultural Organization (UNESCO) Institute for Statistics.
Catégories:
Education
Dernière mise à jour
23 avr. 2017
Les indicateurs de changement de valeurs selon les années
Minimum:
58.437
1 janv. 2000
Maximum:
95.121
1 janv. 2003
Pour la date d''observation
Valeur
Changement absolu
Le changement par rapport à la valeur précédente
1 janv. 2000
58.437
+58.437
0.0%
1 janv. 2003
95.121
+36.684
62.77%
1 janv. 2005
91.535
-3.586
-3.77%
1 janv. 2007
88.822
-2.713
-2.96%
1 janv. 2008
94.463
+5.641
6.35%
1 janv. 2009
91.084
-3.378
-3.58%
1 janv. 2010
84.42
-6.664
-7.32%
1 janv. 2011
91.549
+7.128
8.44%
Classement des pays selon les statistiques actuelles par années


Commentaires: