29
/es/
es
AIzaSyAYiBZKx7MnpbEhh9jyipgxe19OcubqV5w
April 1, 2024
72994
Australia
AUS
true
2
1
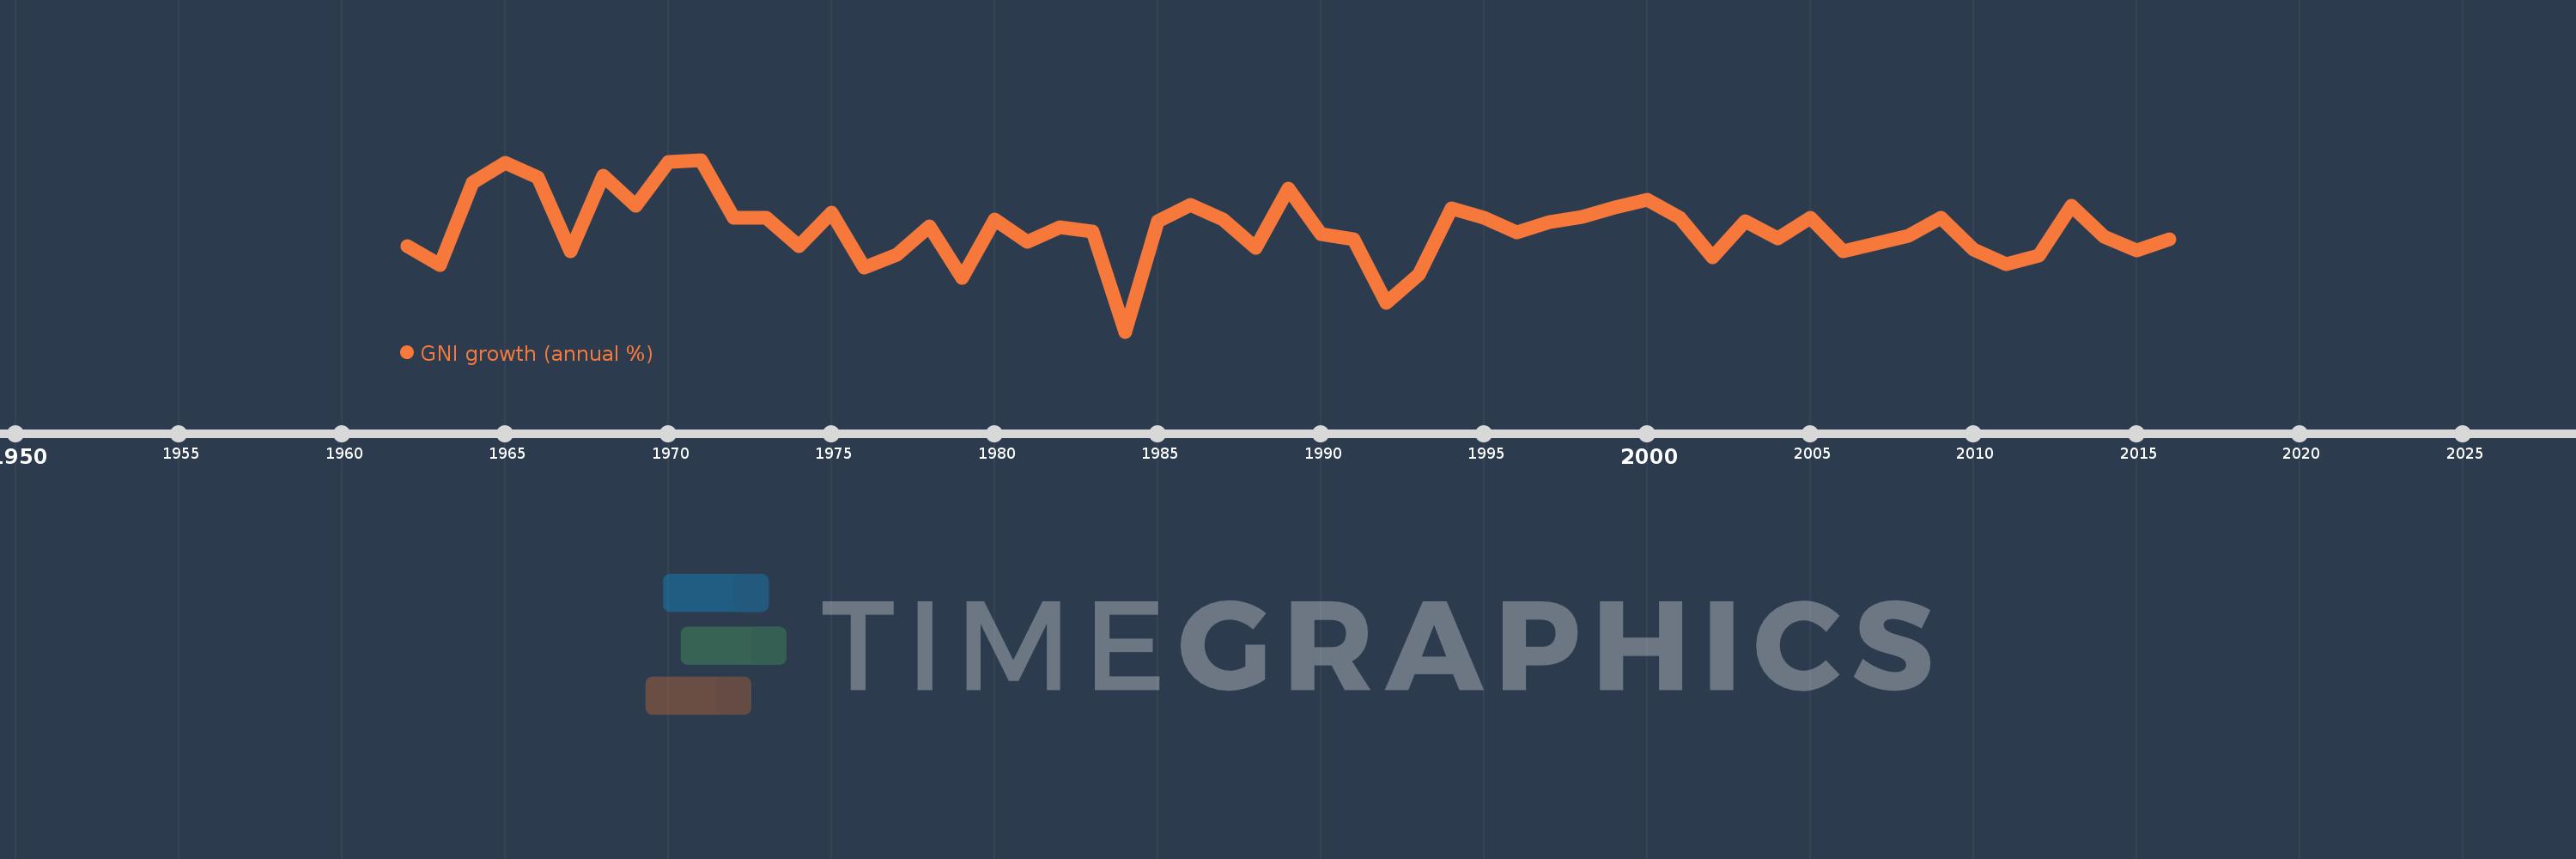
GNI growth (annual %)
2016,2015,2014,2013,2012,2011,2010,2009,2008,2007,2006,2005,2004,2003,2002,2001,2000,1999,1998,1997,1996,1995,1994,1993,1992,1991,1990,1989,1988,1987,1986,1985,1984,1983,1982,1981,1980,1979,1978,1977,1976,1975,1974,1973,1972,1971,1970,1969,1968,1967,1966,1965,1964,1963,1962
Estas estadísticas en otros países:
AlbaniaAlgeriaAngolaAntigua and BarbudaArab WorldArgentinaArmeniaAustraliaAustriaAzerbaijanBahamas, TheBahrainBangladeshBarbadosBelarusBelgiumBelizeBeninBhutanBoliviaBosnia and HerzegovinaBotswanaBrazilBrunei DarussalamBulgariaBurkina FasoBurundiCabo VerdeCambodiaCameroonCanadaCaribbean small statesCentral Europe and the BalticsChadChileChinaColombiaComorosCongo, Dem. Rep.Congo, Rep.Costa RicaCote d'IvoireCroatiaCubaCyprusCzech RepublicDenmarkDjiboutiDominican RepublicEarly-demographic dividendEast Asia & PacificEast Asia & Pacific (excluding high income)East Asia & Pacific (IDA & IBRD countries)EcuadorEgypt, Arab Rep.El SalvadorEquatorial GuineaEritreaEstoniaEthiopiaEuro areaEurope & Central AsiaEurope & Central Asia (excluding high income)Europe & Central Asia (IDA & IBRD countries)European UnionFijiFinlandFranceGabonGambia, TheGeorgiaGermanyGhanaGreeceGuatemalaGuineaGuinea-BissauHaitiHeavily indebted poor countries (HIPC)High incomeHondurasHong Kong SAR, ChinaHungaryIBRD onlyIcelandIDA & IBRD totalIDA blendIDA onlyIDA totalIndiaIndonesiaIran, Islamic Rep.IrelandIsraelItalyJamaicaJapanJordanKazakhstanKenyaKorea, Rep.KosovoKuwaitKyrgyz RepublicLao PDRLate-demographic dividendLatin America & Caribbean Latin America & Caribbean (excluding high income)Latin America & the Caribbean (IDA & IBRD countries)LatviaLeast developed countries: UN classificationLebanonLiberiaLibyaLithuaniaLow & middle incomeLow incomeLower middle incomeLuxembourgMacao SAR, ChinaMacedonia, FYRMadagascarMalawiMalaysiaMaliMaltaMauritaniaMauritiusMexicoMiddle East & North AfricaMiddle East & North Africa (excluding high income)Middle East & North Africa (IDA & IBRD countries)Middle incomeMoldovaMongoliaMontenegroMoroccoMozambiqueMyanmarNamibiaNepalNetherlandsNew ZealandNicaraguaNigerNigeriaNorth AmericaNorwayOECD membersOmanOther small statesPakistanPanamaPapua New GuineaParaguayPeruPhilippinesPolandPortugalPost-demographic dividendPre-demographic dividendPuerto RicoQatarRomaniaRussian FederationRwandaSamoaSaudi ArabiaSenegalSerbiaSeychellesSierra LeoneSingaporeSlovak RepublicSloveniaSmall statesSomaliaSouth AfricaSouth AsiaSouth Asia (IDA & IBRD)South SudanSpainSri LankaSub-Saharan Africa Sub-Saharan Africa (excluding high income)Sub-Saharan Africa (IDA & IBRD countries)SudanSurinameSwazilandSwedenSwitzerlandSyrian Arab RepublicTajikistanTanzaniaThailandTimor-LesteTogoTrinidad and TobagoTunisiaTurkeyTurkmenistanUgandaUkraineUnited Arab EmiratesUnited KingdomUnited StatesUpper middle incomeUruguayUzbekistanVanuatuVenezuela, RBVietnamWest Bank and GazaWorldZambiaZimbabwe línea de tiempo (timeline):
En esta escala de tiempo se presenta un gráfico de 1962 y 2016 de Australia. Los datos de 1961 están ausentes. El número de observaciones reales por fecha: 55.
Fuente (nombre):
Indicadores del desarrollo mundial
Fuente (organización):
World Bank national accounts data, and OECD National Accounts data files.
Categorías:
Economy & Growth
Se ha actualizado:
23 abr 2017 año
Los indicadores de los cambios de valor en los últimos años
Mínimo:
-1.959
1 ene 1984 año
Máximo:
7.166
1 ene 1971 año
A la fecha de observación
Valor
Cambio absoluto
El cambio con respecto al valor anterior
1 ene 1962 año
2.592
+2.592
0.0%
1 ene 1963 año
1.583
-1.01
-38.95%
1 ene 1964 año
5.955
+4.372
276.23%
1 ene 1965 año
7.026
+1.072
18.0%
1 ene 1966 año
6.21
-0.817
-11.62%
1 ene 1967 año
2.305
-3.904
-62.88%
1 ene 1968 año
6.326
+4.021
174.43%
1 ene 1969 año
4.735
-1.591
-25.15%
1 ene 1970 año
7.057
+2.322
49.03%
1 ene 1971 año
7.166
+0.109
1.55%
1 ene 1972 año
4.103
-3.063
-42.74%
1 ene 1973 año
4.08
-0.023
-0.56%
1 ene 1974 año
2.571
-1.51
-37.0%
1 ene 1975 año
4.351
+1.78
69.26%
1 ene 1976 año
1.462
-2.889
-66.4%
1 ene 1977 año
2.117
+0.655
44.77%
1 ene 1978 año
3.608
+1.492
70.48%
1 ene 1979 año
0.887
-2.721
-75.41%
1 ene 1980 año
3.974
+3.087
347.84%
1 ene 1981 año
2.83
-1.144
-28.79%
1 ene 1982 año
3.593
+0.763
26.98%
1 ene 1983 año
3.374
-0.219
-6.11%
1 ene 1984 año
-1.959
-5.332
-158.06%
1 ene 1985 año
3.903
+5.862
-299.25%
1 ene 1986 año
4.753
+0.85
21.78%
1 ene 1987 año
3.999
-0.754
-15.87%
1 ene 1988 año
2.492
-1.507
-37.68%
1 ene 1989 año
5.633
+3.141
126.04%
1 ene 1990 año
3.233
-2.399
-42.6%
1 ene 1991 año
2.923
-0.31
-9.59%
1 ene 1992 año
-0.429
-3.352
-114.67%
1 ene 1993 año
1.073
+1.502
-350.24%
1 ene 1994 año
4.57
+3.497
325.95%
1 ene 1995 año
4.107
-0.463
-10.14%
1 ene 1996 año
3.303
-0.803
-19.56%
1 ene 1997 año
3.844
+0.541
16.38%
1 ene 1998 año
4.119
+0.275
7.16%
1 ene 1999 año
4.656
+0.536
13.02%
1 ene 2000 año
5.062
+0.406
8.71%
1 ene 2001 año
4.096
-0.966
-19.08%
1 ene 2002 año
1.998
-2.098
-51.22%
1 ene 2003 año
3.925
+1.927
96.48%
1 ene 2004 año
2.981
-0.944
-24.06%
1 ene 2005 año
4.079
+1.099
36.86%
1 ene 2006 año
2.303
-1.776
-43.54%
1 ene 2007 año
2.74
+0.437
18.96%
1 ene 2008 año
3.108
+0.368
13.42%
1 ene 2009 año
4.064
+0.956
30.77%
1 ene 2010 año
2.379
-1.685
-41.46%
1 ene 2011 año
1.638
-0.741
-31.13%
1 ene 2012 año
2.077
+0.438
26.74%
1 ene 2013 año
4.707
+2.63
126.65%
1 ene 2014 año
3.069
-1.637
-34.78%
1 ene 2015 año
2.36
-0.709
-23.1%
1 ene 2016 año
2.938
+0.577
24.45%
Ranking de los países por los datos estadísticos actuales


Comentarios: