29
/es/
es
AIzaSyAYiBZKx7MnpbEhh9jyipgxe19OcubqV5w
April 1, 2024
216446
Pakistan
PAK
true
2
1
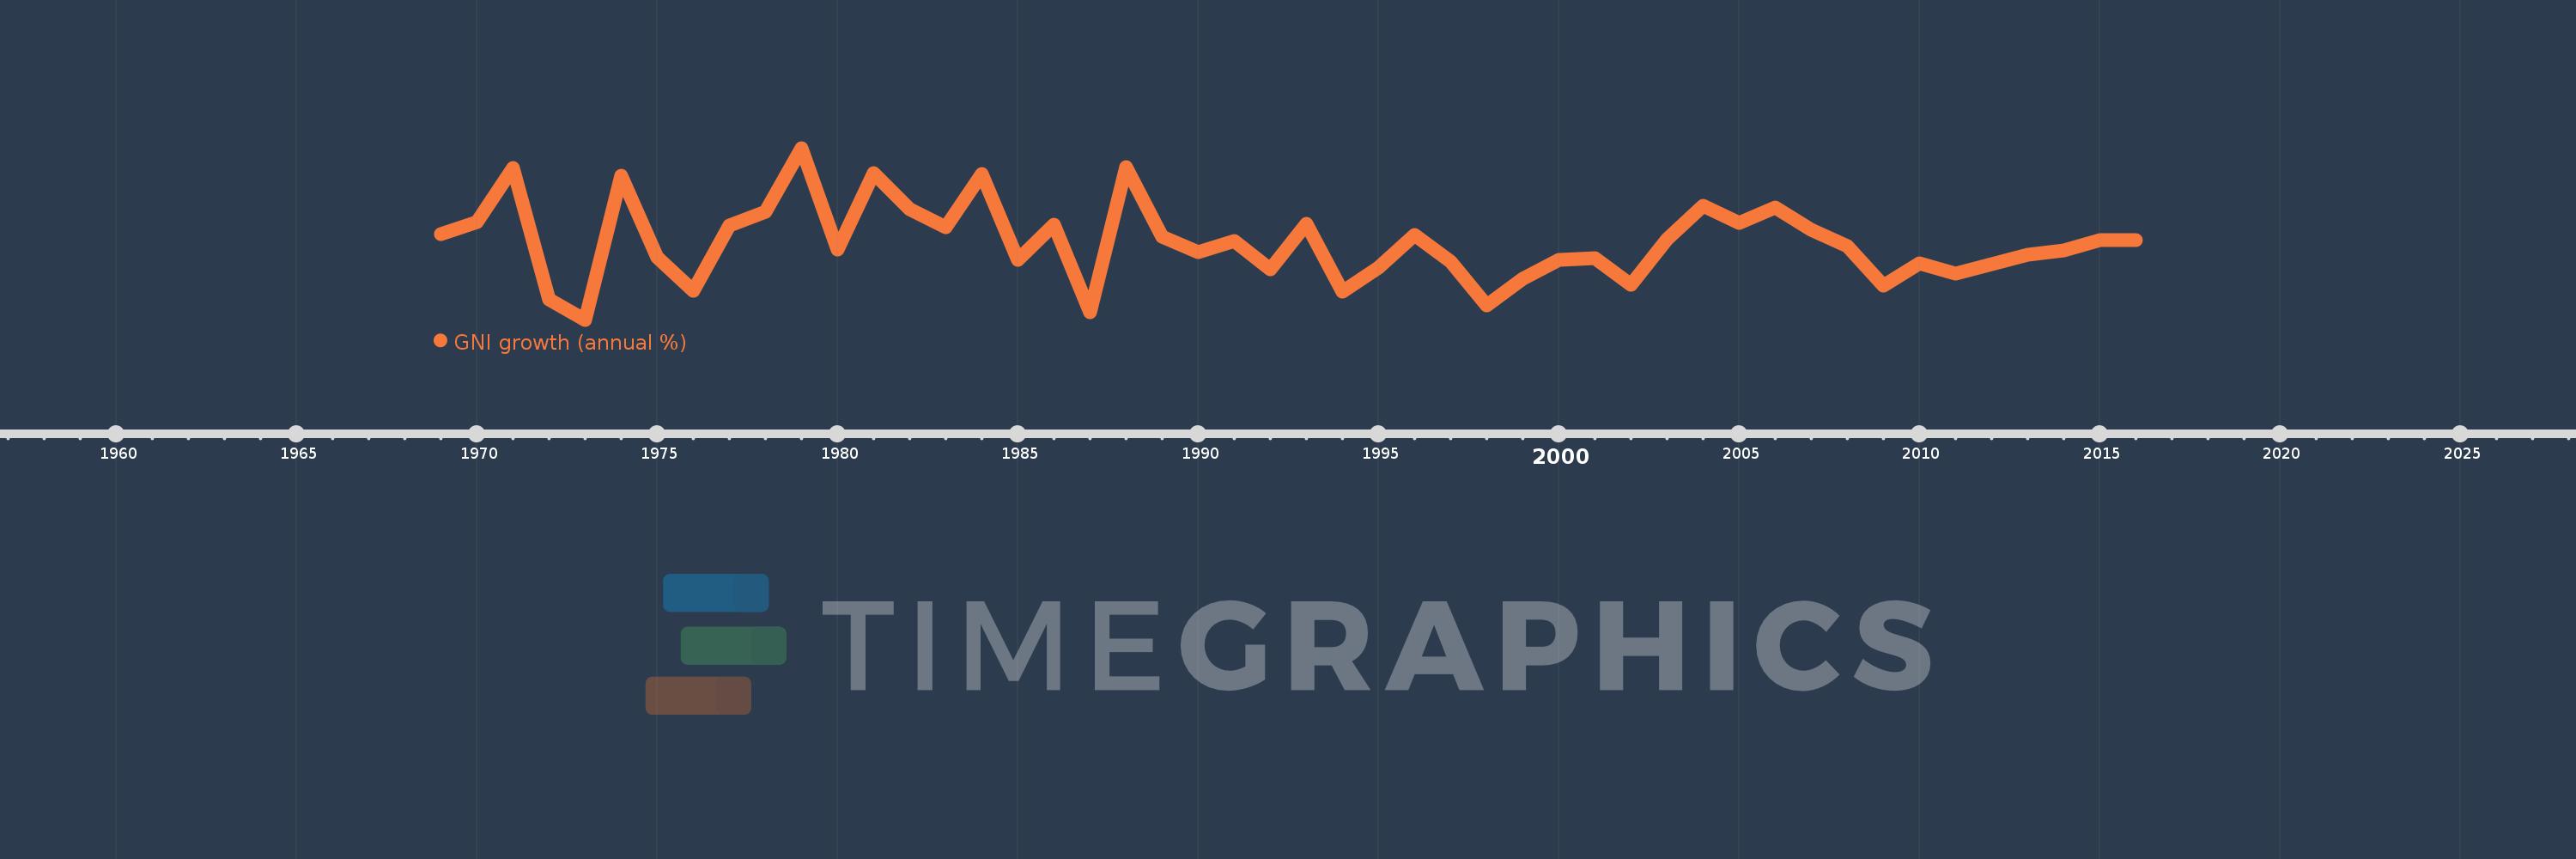
GNI growth (annual %)
2016,2015,2014,2013,2012,2011,2010,2009,2008,2007,2006,2005,2004,2003,2002,2001,2000,1999,1998,1997,1996,1995,1994,1993,1992,1991,1990,1989,1988,1987,1986,1985,1984,1983,1982,1981,1980,1979,1978,1977,1976,1975,1974,1973,1972,1971,1970,1969
Estas estadísticas en otros países:
AlbaniaAlgeriaAngolaAntigua and BarbudaArab WorldArgentinaArmeniaAustraliaAustriaAzerbaijanBahamas, TheBahrainBangladeshBarbadosBelarusBelgiumBelizeBeninBhutanBoliviaBosnia and HerzegovinaBotswanaBrazilBrunei DarussalamBulgariaBurkina FasoBurundiCabo VerdeCambodiaCameroonCanadaCaribbean small statesCentral Europe and the BalticsChadChileChinaColombiaComorosCongo, Dem. Rep.Congo, Rep.Costa RicaCote d'IvoireCroatiaCubaCyprusCzech RepublicDenmarkDjiboutiDominican RepublicEarly-demographic dividendEast Asia & PacificEast Asia & Pacific (excluding high income)East Asia & Pacific (IDA & IBRD countries)EcuadorEgypt, Arab Rep.El SalvadorEquatorial GuineaEritreaEstoniaEthiopiaEuro areaEurope & Central AsiaEurope & Central Asia (excluding high income)Europe & Central Asia (IDA & IBRD countries)European UnionFijiFinlandFranceGabonGambia, TheGeorgiaGermanyGhanaGreeceGuatemalaGuineaGuinea-BissauHaitiHeavily indebted poor countries (HIPC)High incomeHondurasHong Kong SAR, ChinaHungaryIBRD onlyIcelandIDA & IBRD totalIDA blendIDA onlyIDA totalIndiaIndonesiaIran, Islamic Rep.IrelandIsraelItalyJamaicaJapanJordanKazakhstanKenyaKorea, Rep.KosovoKuwaitKyrgyz RepublicLao PDRLate-demographic dividendLatin America & Caribbean Latin America & Caribbean (excluding high income)Latin America & the Caribbean (IDA & IBRD countries)LatviaLeast developed countries: UN classificationLebanonLiberiaLibyaLithuaniaLow & middle incomeLow incomeLower middle incomeLuxembourgMacao SAR, ChinaMacedonia, FYRMadagascarMalawiMalaysiaMaliMaltaMauritaniaMauritiusMexicoMiddle East & North AfricaMiddle East & North Africa (excluding high income)Middle East & North Africa (IDA & IBRD countries)Middle incomeMoldovaMongoliaMontenegroMoroccoMozambiqueMyanmarNamibiaNepalNetherlandsNew ZealandNicaraguaNigerNigeriaNorth AmericaNorwayOECD membersOmanOther small statesPakistanPanamaPapua New GuineaParaguayPeruPhilippinesPolandPortugalPost-demographic dividendPre-demographic dividendPuerto RicoQatarRomaniaRussian FederationRwandaSamoaSaudi ArabiaSenegalSerbiaSeychellesSierra LeoneSingaporeSlovak RepublicSloveniaSmall statesSomaliaSouth AfricaSouth AsiaSouth Asia (IDA & IBRD)South SudanSpainSri LankaSub-Saharan Africa Sub-Saharan Africa (excluding high income)Sub-Saharan Africa (IDA & IBRD countries)SudanSurinameSwazilandSwedenSwitzerlandSyrian Arab RepublicTajikistanTanzaniaThailandTimor-LesteTogoTrinidad and TobagoTunisiaTurkeyTurkmenistanUgandaUkraineUnited Arab EmiratesUnited KingdomUnited StatesUpper middle incomeUruguayUzbekistanVanuatuVenezuela, RBVietnamWest Bank and GazaWorldZambiaZimbabwe línea de tiempo (timeline):
En esta escala de tiempo se presenta un gráfico de 1969 y 2016 de Pakistan. Los datos de 1968 están ausentes. El número de observaciones reales por fecha: 48.
Fuente (nombre):
Indicadores del desarrollo mundial
Fuente (organización):
World Bank national accounts data, and OECD National Accounts data files.
Categorías:
Economy & Growth
Se ha actualizado:
23 abr 2017 año
Los indicadores de los cambios de valor en los últimos años
Mínimo:
-0.53
1 ene 1973 año
Máximo:
11.74
1 ene 1979 año
A la fecha de observación
Valor
Cambio absoluto
El cambio con respecto al valor anterior
1 ene 1969 año
5.559
+5.559
0.0%
1 ene 1970 año
6.463
+0.904
16.25%
1 ene 1971 año
10.293
+3.83
59.26%
1 ene 1972 año
0.951
-9.342
-90.76%
1 ene 1973 año
-0.53
-1.481
-155.78%
1 ene 1974 año
9.729
+10.259
-1.93 mil%
1 ene 1975 año
3.921
-5.807
-59.69%
1 ene 1976 año
1.531
-2.391
-60.96%
1 ene 1977 año
6.199
+4.668
304.95%
1 ene 1978 año
7.2
+1.001
16.15%
1 ene 1979 año
11.74
+4.541
63.07%
1 ene 1980 año
4.473
-7.267
-61.9%
1 ene 1981 año
9.965
+5.491
122.76%
1 ene 1982 año
7.357
-2.607
-26.17%
1 ene 1983 año
6.064
-1.294
-17.59%
1 ene 1984 año
9.89
+3.826
63.1%
1 ene 1985 año
3.768
-6.122
-61.9%
1 ene 1986 año
6.242
+2.474
65.67%
1 ene 1987 año
0.013
-6.23
-99.8%
1 ene 1988 año
10.345
+10.333
81.74 mil%
1 ene 1989 año
5.407
-4.938
-47.73%
1 ene 1990 año
4.27
-1.137
-21.02%
1 ene 1991 año
5.106
+0.836
19.57%
1 ene 1992 año
3.086
-2.021
-39.57%
1 ene 1993 año
6.295
+3.209
104.01%
1 ene 1994 año
1.446
-4.848
-77.02%
1 ene 1995 año
3.21
+1.764
121.93%
1 ene 1996 año
5.514
+2.304
71.76%
1 ene 1997 año
3.652
-1.862
-33.77%
1 ene 1998 año
0.525
-3.127
-85.63%
1 ene 1999 año
2.399
+1.874
357.24%
1 ene 2000 año
3.721
+1.322
55.11%
1 ene 2001 año
3.852
+0.131
3.52%
1 ene 2002 año
1.949
-1.903
-49.41%
1 ene 2003 año
5.214
+3.265
167.54%
1 ene 2004 año
7.623
+2.409
46.21%
1 ene 2005 año
6.373
-1.25
-16.4%
1 ene 2006 año
7.502
+1.13
17.73%
1 ene 2007 año
5.887
-1.615
-21.53%
1 ene 2008 año
4.702
-1.185
-20.13%
1 ene 2009 año
1.912
-2.79
-59.34%
1 ene 2010 año
3.49
+1.578
82.54%
1 ene 2011 año
2.76
-0.731
-20.93%
1 ene 2012 año
3.422
+0.663
24.02%
1 ene 2013 año
4.093
+0.671
19.59%
1 ene 2014 año
4.409
+0.316
7.73%
1 ene 2015 año
5.164
+0.755
17.13%
1 ene 2016 año
5.132
-0.033
-0.63%
Ranking de los países por los datos estadísticos actuales


Comentarios: