29
/es/
es
AIzaSyAYiBZKx7MnpbEhh9jyipgxe19OcubqV5w
April 1, 2024
156009
Indonesia
IDN
true
2
1
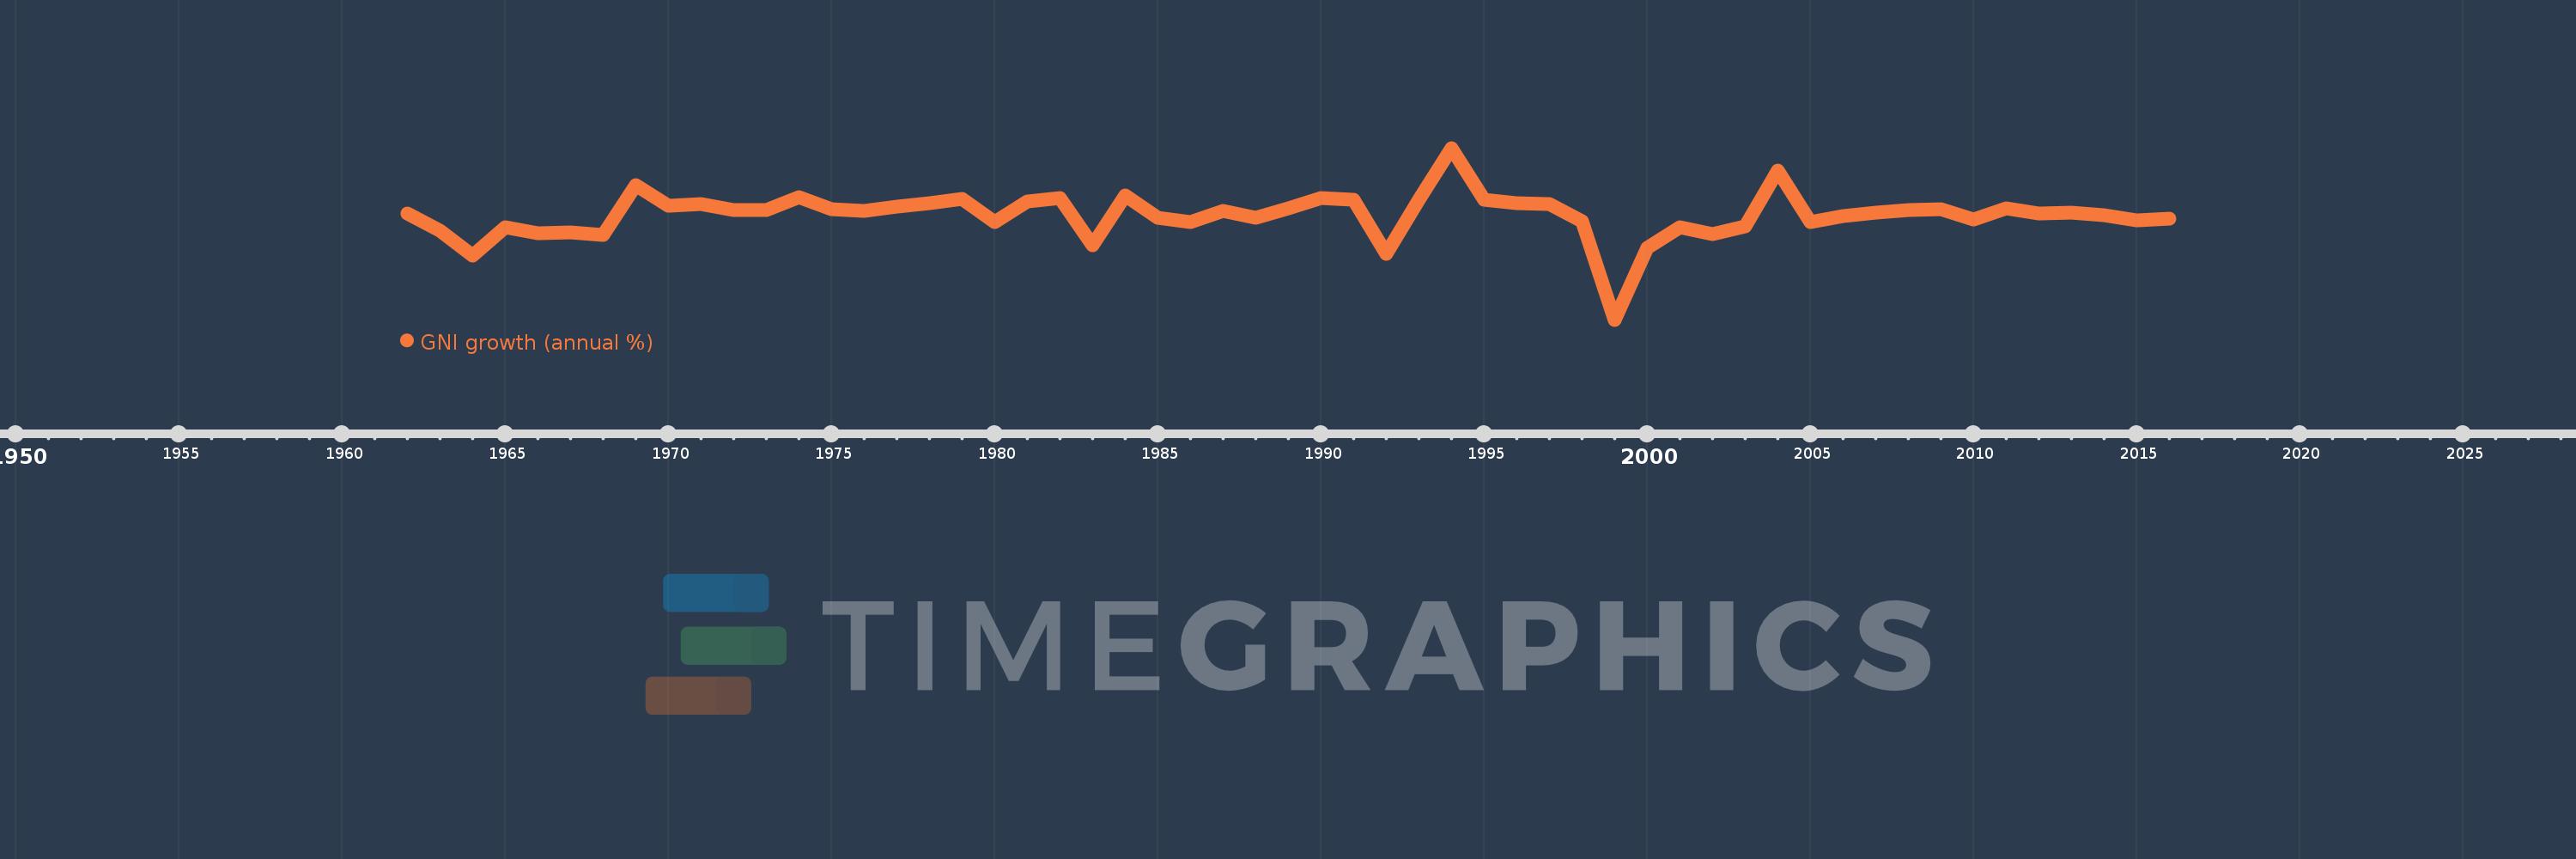
GNI growth (annual %)
2016,2015,2014,2013,2012,2011,2010,2009,2008,2007,2006,2005,2004,2003,2002,2001,2000,1999,1998,1997,1996,1995,1994,1993,1992,1991,1990,1989,1988,1987,1986,1985,1984,1983,1982,1981,1980,1979,1978,1977,1976,1975,1974,1973,1972,1971,1970,1969,1968,1967,1966,1965,1964,1963,1962
Estas estadísticas en otros países:
AlbaniaAlgeriaAngolaAntigua and BarbudaArab WorldArgentinaArmeniaAustraliaAustriaAzerbaijanBahamas, TheBahrainBangladeshBarbadosBelarusBelgiumBelizeBeninBhutanBoliviaBosnia and HerzegovinaBotswanaBrazilBrunei DarussalamBulgariaBurkina FasoBurundiCabo VerdeCambodiaCameroonCanadaCaribbean small statesCentral Europe and the BalticsChadChileChinaColombiaComorosCongo, Dem. Rep.Congo, Rep.Costa RicaCote d'IvoireCroatiaCubaCyprusCzech RepublicDenmarkDjiboutiDominican RepublicEarly-demographic dividendEast Asia & PacificEast Asia & Pacific (excluding high income)East Asia & Pacific (IDA & IBRD countries)EcuadorEgypt, Arab Rep.El SalvadorEquatorial GuineaEritreaEstoniaEthiopiaEuro areaEurope & Central AsiaEurope & Central Asia (excluding high income)Europe & Central Asia (IDA & IBRD countries)European UnionFijiFinlandFranceGabonGambia, TheGeorgiaGermanyGhanaGreeceGuatemalaGuineaGuinea-BissauHaitiHeavily indebted poor countries (HIPC)High incomeHondurasHong Kong SAR, ChinaHungaryIBRD onlyIcelandIDA & IBRD totalIDA blendIDA onlyIDA totalIndiaIndonesiaIran, Islamic Rep.IrelandIsraelItalyJamaicaJapanJordanKazakhstanKenyaKorea, Rep.KosovoKuwaitKyrgyz RepublicLao PDRLate-demographic dividendLatin America & Caribbean Latin America & Caribbean (excluding high income)Latin America & the Caribbean (IDA & IBRD countries)LatviaLeast developed countries: UN classificationLebanonLiberiaLibyaLithuaniaLow & middle incomeLow incomeLower middle incomeLuxembourgMacao SAR, ChinaMacedonia, FYRMadagascarMalawiMalaysiaMaliMaltaMauritaniaMauritiusMexicoMiddle East & North AfricaMiddle East & North Africa (excluding high income)Middle East & North Africa (IDA & IBRD countries)Middle incomeMoldovaMongoliaMontenegroMoroccoMozambiqueMyanmarNamibiaNepalNetherlandsNew ZealandNicaraguaNigerNigeriaNorth AmericaNorwayOECD membersOmanOther small statesPakistanPanamaPapua New GuineaParaguayPeruPhilippinesPolandPortugalPost-demographic dividendPre-demographic dividendPuerto RicoQatarRomaniaRussian FederationRwandaSamoaSaudi ArabiaSenegalSerbiaSeychellesSierra LeoneSingaporeSlovak RepublicSloveniaSmall statesSomaliaSouth AfricaSouth AsiaSouth Asia (IDA & IBRD)South SudanSpainSri LankaSub-Saharan Africa Sub-Saharan Africa (excluding high income)Sub-Saharan Africa (IDA & IBRD countries)SudanSurinameSwazilandSwedenSwitzerlandSyrian Arab RepublicTajikistanTanzaniaThailandTimor-LesteTogoTrinidad and TobagoTunisiaTurkeyTurkmenistanUgandaUkraineUnited Arab EmiratesUnited KingdomUnited StatesUpper middle incomeUruguayUzbekistanVanuatuVenezuela, RBVietnamWest Bank and GazaWorldZambiaZimbabwe línea de tiempo (timeline):
En esta escala de tiempo se presenta un gráfico de 1962 y 2016 de Indonesia. Los datos de 1961 están ausentes. El número de observaciones reales por fecha: 55.
Fuente (nombre):
Indicadores del desarrollo mundial
Fuente (organización):
World Bank national accounts data, and OECD National Accounts data files.
Categorías:
Economy & Growth
Se ha actualizado:
23 abr 2017 año
Los indicadores de los cambios de valor en los últimos años
Mínimo:
-16.038
1 ene 1999 año
Máximo:
19.522
1 ene 1994 año
A la fecha de observación
Valor
Cambio absoluto
El cambio con respecto al valor anterior
1 ene 1962 año
5.921
+5.921
0.0%
1 ene 1963 año
2.386
-3.535
-59.71%
1 ene 1964 año
-2.786
-5.172
-216.77%
1 ene 1965 año
3.04
+5.826
-209.11%
1 ene 1966 año
1.809
-1.23
-40.48%
1 ene 1967 año
2.08
+0.27
14.95%
1 ene 1968 año
1.497
-0.582
-28.0%
1 ene 1969 año
11.822
+10.325
689.5%
1 ene 1970 año
7.552
-4.271
-36.12%
1 ene 1971 año
7.948
+0.396
5.25%
1 ene 1972 año
6.672
-1.276
-16.05%
1 ene 1973 año
6.646
-0.026
-0.4%
1 ene 1974 año
9.294
+2.648
39.85%
1 ene 1975 año
6.896
-2.398
-25.8%
1 ene 1976 año
6.544
-0.352
-5.1%
1 ene 1977 año
7.368
+0.824
12.59%
1 ene 1978 año
8.139
+0.771
10.46%
1 ene 1979 año
8.917
+0.778
9.56%
1 ene 1980 año
4.097
-4.821
-54.06%
1 ene 1981 año
8.519
+4.423
107.95%
1 ene 1982 año
9.138
+0.619
7.26%
1 ene 1983 año
-0.544
-9.682
-105.95%
1 ene 1984 año
9.64
+10.184
-1.87 mil%
1 ene 1985 año
5.025
-4.615
-47.88%
1 ene 1986 año
4.24
-0.784
-15.61%
1 ene 1987 año
6.561
+2.321
54.73%
1 ene 1988 año
5.023
-1.538
-23.45%
1 ene 1989 año
6.98
+1.958
38.97%
1 ene 1990 año
9.074
+2.094
30.0%
1 ene 1991 año
8.813
-0.262
-2.88%
1 ene 1992 año
-2.445
-11.258
-127.75%
1 ene 1993 año
8.729
+11.174
-456.96%
1 ene 1994 año
19.522
+10.793
123.64%
1 ene 1995 año
8.823
-10.699
-54.8%
1 ene 1996 año
8.104
-0.718
-8.14%
1 ene 1997 año
7.919
-0.185
-2.29%
1 ene 1998 año
4.372
-3.547
-44.79%
1 ene 1999 año
-16.038
-20.409
-466.83%
1 ene 2000 año
-1.186
+14.851
-92.6%
1 ene 2001 año
3.105
+4.291
-361.7%
1 ene 2002 año
1.737
-1.368
-44.05%
1 ene 2003 año
3.265
+1.528
87.96%
1 ene 2004 año
14.823
+11.558
353.96%
1 ene 2005 año
4.226
-10.597
-71.49%
1 ene 2006 año
5.397
+1.172
27.73%
1 ene 2007 año
6.141
+0.744
13.79%
1 ene 2008 año
6.581
+0.44
7.16%
1 ene 2009 año
6.771
+0.19
2.89%
1 ene 2010 año
4.663
-2.109
-31.14%
1 ene 2011 año
7.087
+2.424
51.99%
1 ene 2012 año
5.901
-1.186
-16.74%
1 ene 2013 año
6.151
+0.25
4.24%
1 ene 2014 año
5.518
-0.633
-10.29%
1 ene 2015 año
4.62
-0.898
-16.28%
1 ene 2016 año
4.875
+0.255
5.51%
Ranking de los países por los datos estadísticos actuales


Comentarios: