29
/es/
es
AIzaSyAYiBZKx7MnpbEhh9jyipgxe19OcubqV5w
April 1, 2024
235792
Senegal
SEN
true
2
1
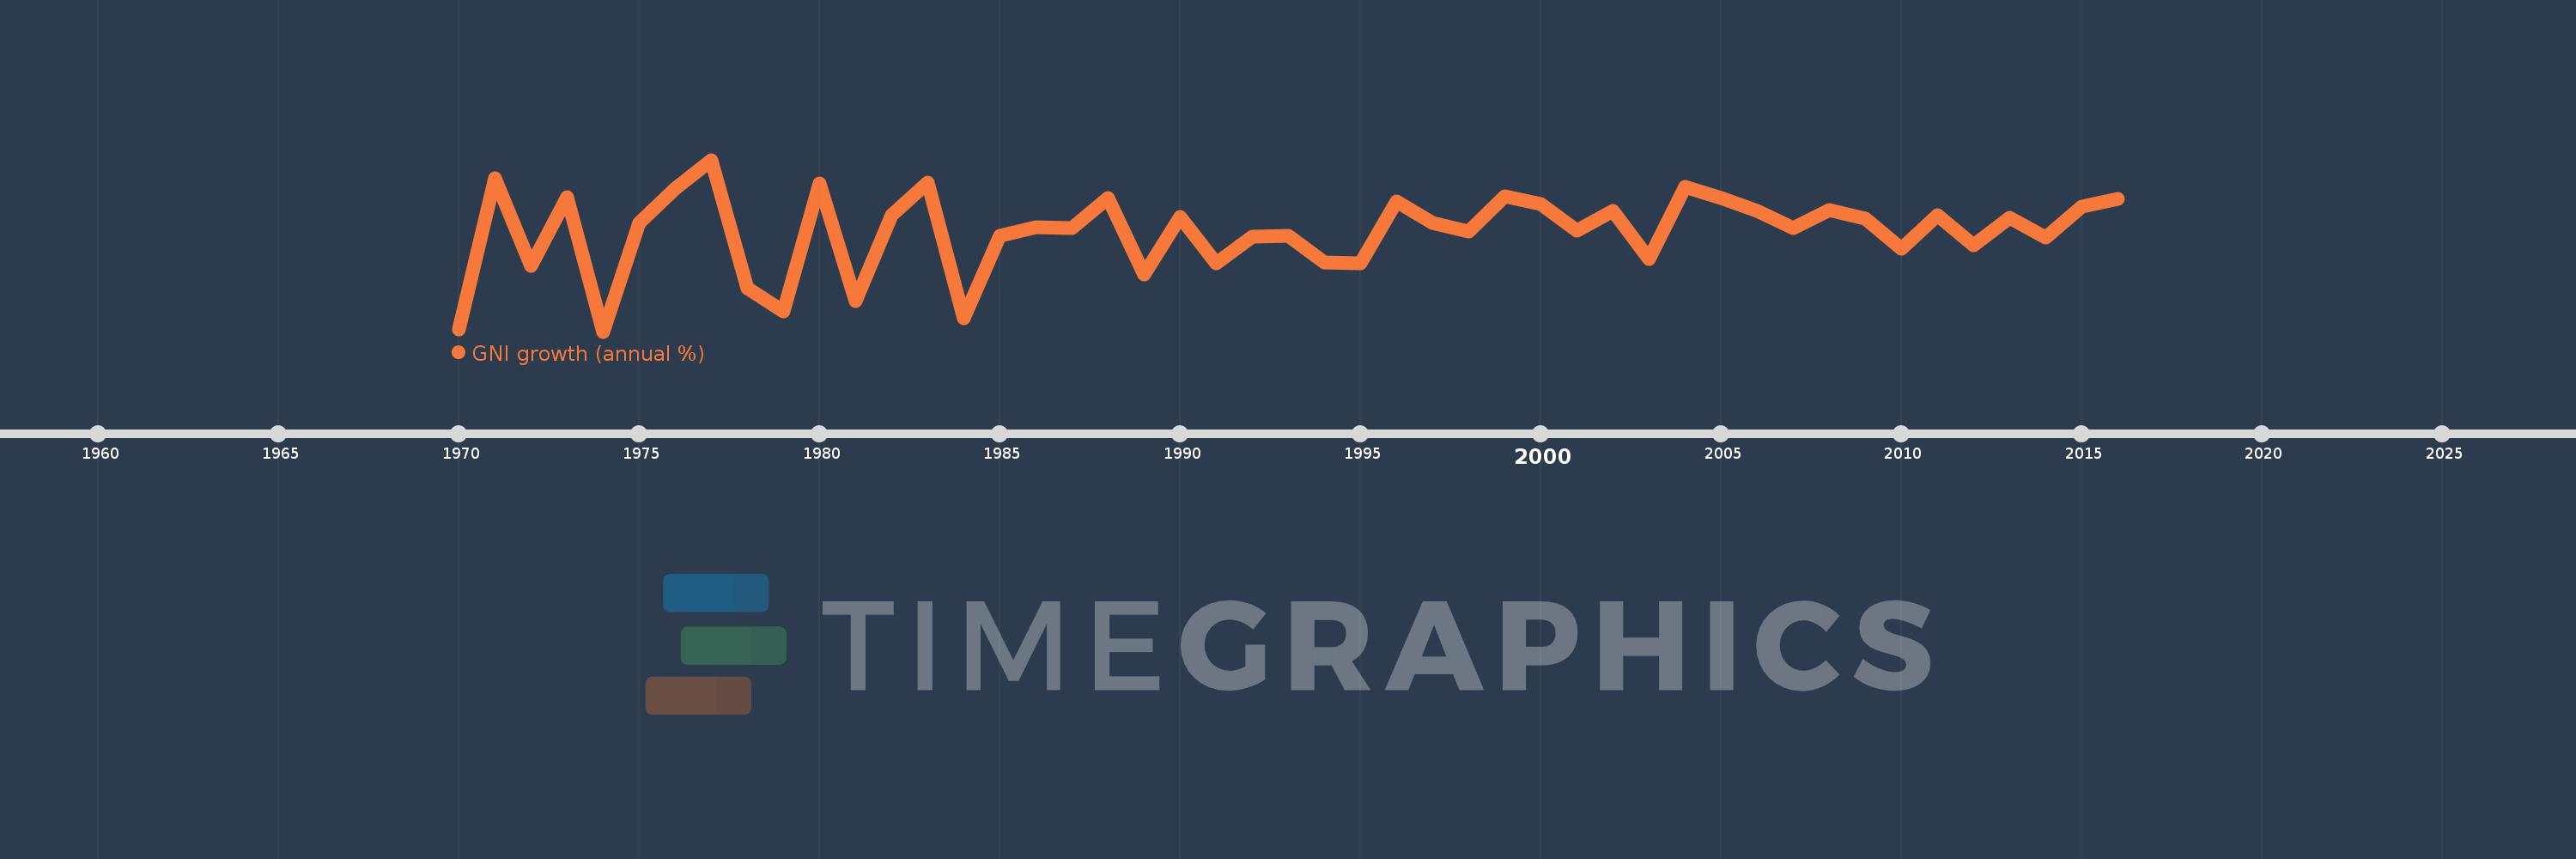
GNI growth (annual %)
2016,2015,2014,2013,2012,2011,2010,2009,2008,2007,2006,2005,2004,2003,2002,2001,2000,1999,1998,1997,1996,1995,1994,1993,1992,1991,1990,1989,1988,1987,1986,1985,1984,1983,1982,1981,1980,1979,1978,1977,1976,1975,1974,1973,1972,1971,1970
Estas estadísticas en otros países:
AlbaniaAlgeriaAngolaAntigua and BarbudaArab WorldArgentinaArmeniaAustraliaAustriaAzerbaijanBahamas, TheBahrainBangladeshBarbadosBelarusBelgiumBelizeBeninBhutanBoliviaBosnia and HerzegovinaBotswanaBrazilBrunei DarussalamBulgariaBurkina FasoBurundiCabo VerdeCambodiaCameroonCanadaCaribbean small statesCentral Europe and the BalticsChadChileChinaColombiaComorosCongo, Dem. Rep.Congo, Rep.Costa RicaCote d'IvoireCroatiaCubaCyprusCzech RepublicDenmarkDjiboutiDominican RepublicEarly-demographic dividendEast Asia & PacificEast Asia & Pacific (excluding high income)East Asia & Pacific (IDA & IBRD countries)EcuadorEgypt, Arab Rep.El SalvadorEquatorial GuineaEritreaEstoniaEthiopiaEuro areaEurope & Central AsiaEurope & Central Asia (excluding high income)Europe & Central Asia (IDA & IBRD countries)European UnionFijiFinlandFranceGabonGambia, TheGeorgiaGermanyGhanaGreeceGuatemalaGuineaGuinea-BissauHaitiHeavily indebted poor countries (HIPC)High incomeHondurasHong Kong SAR, ChinaHungaryIBRD onlyIcelandIDA & IBRD totalIDA blendIDA onlyIDA totalIndiaIndonesiaIran, Islamic Rep.IrelandIsraelItalyJamaicaJapanJordanKazakhstanKenyaKorea, Rep.KosovoKuwaitKyrgyz RepublicLao PDRLate-demographic dividendLatin America & Caribbean Latin America & Caribbean (excluding high income)Latin America & the Caribbean (IDA & IBRD countries)LatviaLeast developed countries: UN classificationLebanonLiberiaLibyaLithuaniaLow & middle incomeLow incomeLower middle incomeLuxembourgMacao SAR, ChinaMacedonia, FYRMadagascarMalawiMalaysiaMaliMaltaMauritaniaMauritiusMexicoMiddle East & North AfricaMiddle East & North Africa (excluding high income)Middle East & North Africa (IDA & IBRD countries)Middle incomeMoldovaMongoliaMontenegroMoroccoMozambiqueMyanmarNamibiaNepalNetherlandsNew ZealandNicaraguaNigerNigeriaNorth AmericaNorwayOECD membersOmanOther small statesPakistanPanamaPapua New GuineaParaguayPeruPhilippinesPolandPortugalPost-demographic dividendPre-demographic dividendPuerto RicoQatarRomaniaRussian FederationRwandaSamoaSaudi ArabiaSenegalSerbiaSeychellesSierra LeoneSingaporeSlovak RepublicSloveniaSmall statesSomaliaSouth AfricaSouth AsiaSouth Asia (IDA & IBRD)South SudanSpainSri LankaSub-Saharan Africa Sub-Saharan Africa (excluding high income)Sub-Saharan Africa (IDA & IBRD countries)SudanSurinameSwazilandSwedenSwitzerlandSyrian Arab RepublicTajikistanTanzaniaThailandTimor-LesteTogoTrinidad and TobagoTunisiaTurkeyTurkmenistanUgandaUkraineUnited Arab EmiratesUnited KingdomUnited StatesUpper middle incomeUruguayUzbekistanVanuatuVenezuela, RBVietnamWest Bank and GazaWorldZambiaZimbabwe línea de tiempo (timeline):
En esta escala de tiempo se presenta un gráfico de 1970 y 2016 de Senegal. Los datos de 1969 están ausentes. El número de observaciones reales por fecha: 47.
Fuente (nombre):
Indicadores del desarrollo mundial
Fuente (organización):
World Bank national accounts data, and OECD National Accounts data files.
Categorías:
Economy & Growth
Se ha actualizado:
23 abr 2017 año
Los indicadores de los cambios de valor en los últimos años
Mínimo:
-6.514
1 ene 1974 año
Máximo:
9.803
1 ene 1977 año
A la fecha de observación
Valor
Cambio absoluto
El cambio con respecto al valor anterior
1 ene 1970 año
-6.304
-6.304
0.0%
1 ene 1971 año
8.083
+14.387
-228.23%
1 ene 1972 año
-0.239
-8.323
-102.96%
1 ene 1973 año
6.248
+6.487
-2.71 mil%
1 ene 1974 año
-6.514
-12.762
-204.25%
1 ene 1975 año
3.843
+10.357
-159.0%
1 ene 1976 año
7.103
+3.26
84.82%
1 ene 1977 año
9.803
+2.7
38.01%
1 ene 1978 año
-2.409
-12.211
-124.57%
1 ene 1979 año
-4.556
-2.147
89.14%
1 ene 1980 año
7.538
+12.094
-265.44%
1 ene 1981 año
-3.641
-11.179
-148.31%
1 ene 1982 año
4.544
+8.185
-224.77%
1 ene 1983 año
7.668
+3.125
68.77%
1 ene 1984 año
-5.227
-12.895
-168.17%
1 ene 1985 año
2.566
+7.793
-149.09%
1 ene 1986 año
3.392
+0.826
32.2%
1 ene 1987 año
3.354
-0.038
-1.11%
1 ene 1988 año
6.141
+2.787
83.08%
1 ene 1989 año
-1.102
-7.244
-117.95%
1 ene 1990 año
4.382
+5.485
-497.52%
1 ene 1991 año
-0.049
-4.432
-101.12%
1 ene 1992 año
2.531
+2.58
-5.25 mil%
1 ene 1993 año
2.582
+0.051
2.03%
1 ene 1994 año
0.031
-2.551
-98.8%
1 ene 1995 año
-0.012
-0.043
-138.64%
1 ene 1996 año
5.848
+5.86
-48.92 mil%
1 ene 1997 año
3.769
-2.08
-35.56%
1 ene 1998 año
2.997
-0.772
-20.49%
1 ene 1999 año
6.36
+3.363
112.22%
1 ene 2000 año
5.603
-0.757
-11.9%
1 ene 2001 año
3.063
-2.54
-45.33%
1 ene 2002 año
4.94
+1.876
61.26%
1 ene 2003 año
0.359
-4.58
-92.73%
1 ene 2004 año
7.256
+6.896
1.92 mil%
1 ene 2005 año
6.161
-1.095
-15.09%
1 ene 2006 año
4.943
-1.218
-19.77%
1 ene 2007 año
3.314
-1.629
-32.96%
1 ene 2008 año
5.034
+1.72
51.91%
1 ene 2009 año
4.186
-0.848
-16.84%
1 ene 2010 año
1.38
-2.806
-67.03%
1 ene 2011 año
4.569
+3.189
231.05%
1 ene 2012 año
1.654
-2.915
-63.8%
1 ene 2013 año
4.324
+2.67
161.44%
1 ene 2014 año
2.438
-1.886
-43.61%
1 ene 2015 año
5.319
+2.881
118.17%
1 ene 2016 año
6.081
+0.761
14.31%
Ranking de los países por los datos estadísticos actuales


Comentarios: