29
/es/
es
AIzaSyAYiBZKx7MnpbEhh9jyipgxe19OcubqV5w
April 1, 2024
226769
Puerto Rico
PRI
true
2
1
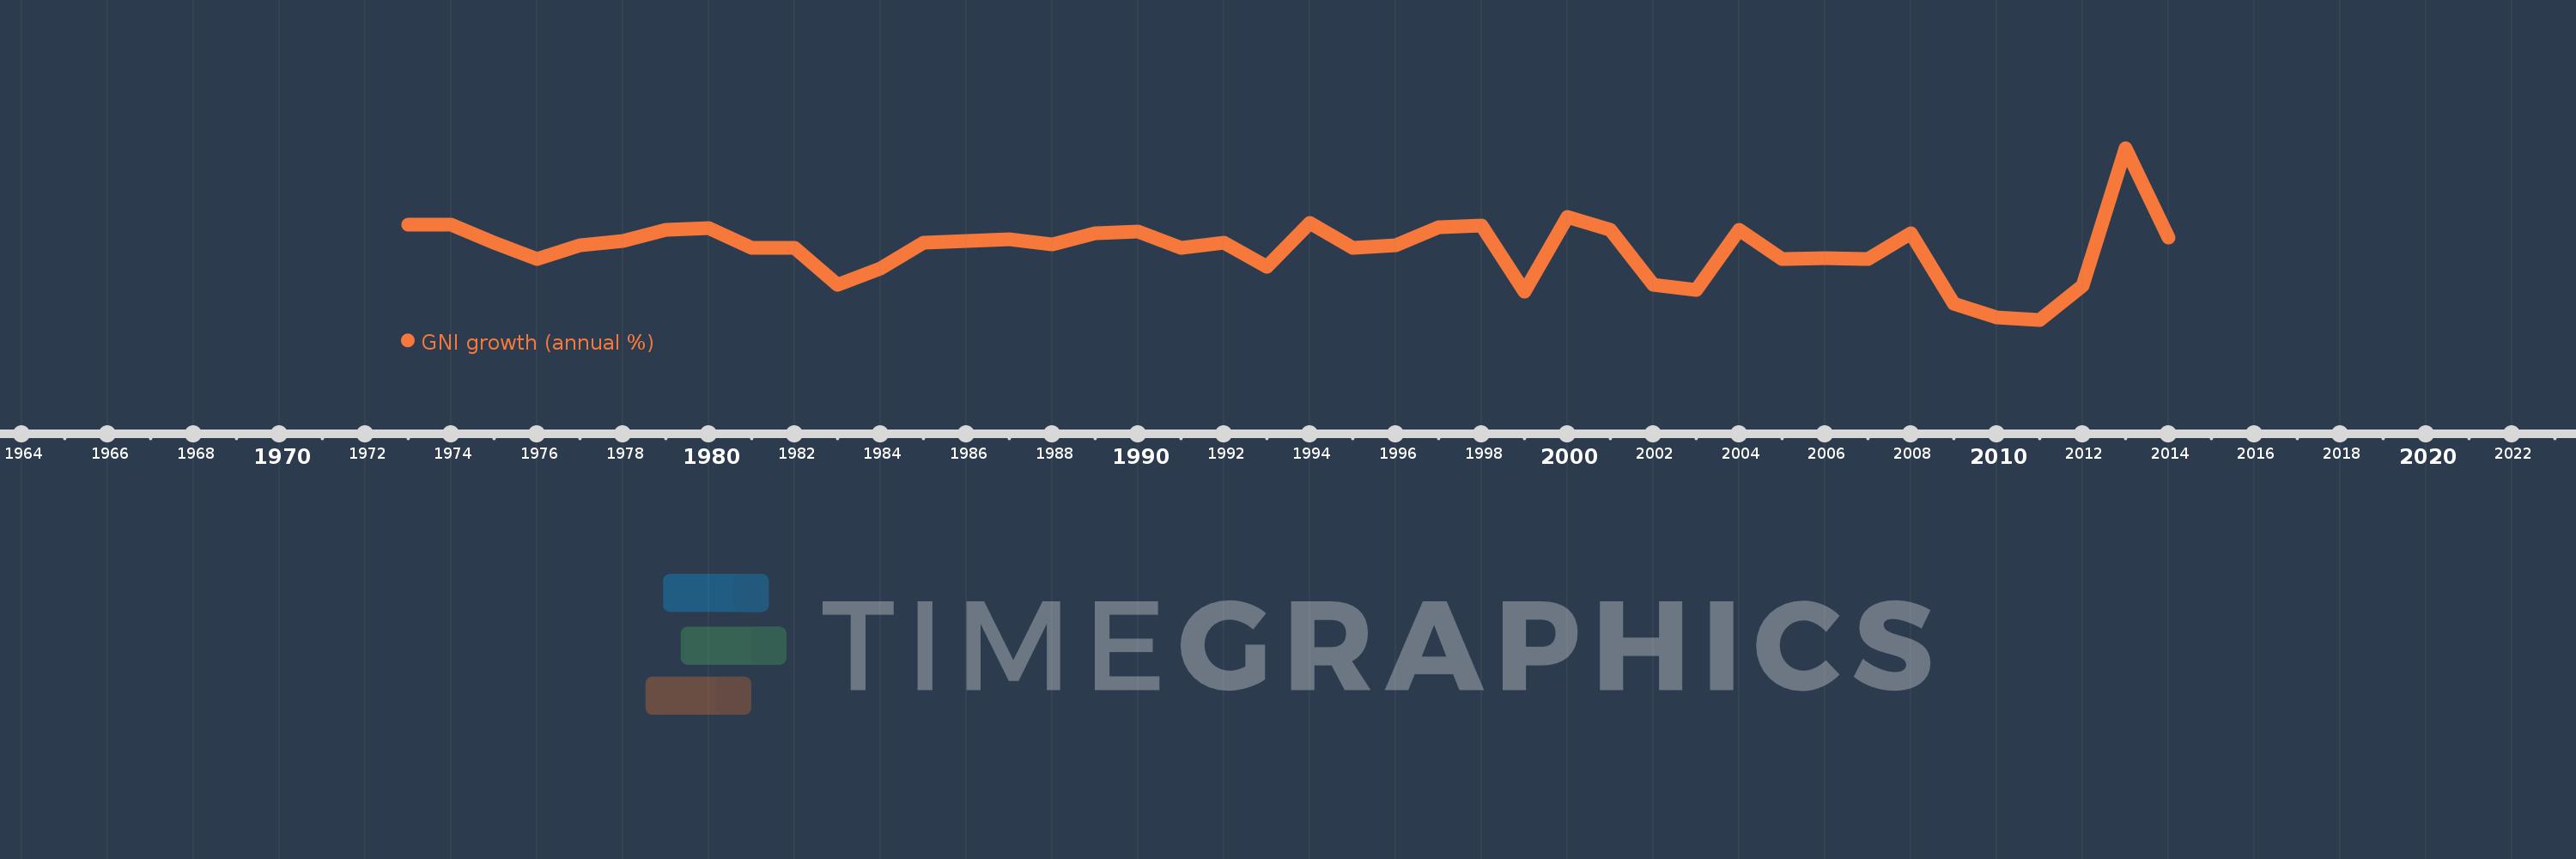
GNI growth (annual %)
2014,2013,2012,2011,2010,2009,2008,2007,2006,2005,2004,2003,2002,2001,2000,1999,1998,1997,1996,1995,1994,1993,1992,1991,1990,1989,1988,1987,1986,1985,1984,1983,1982,1981,1980,1979,1978,1977,1976,1975,1974,1973
Estas estadísticas en otros países:
AlbaniaAlgeriaAngolaAntigua and BarbudaArab WorldArgentinaArmeniaAustraliaAustriaAzerbaijanBahamas, TheBahrainBangladeshBarbadosBelarusBelgiumBelizeBeninBhutanBoliviaBosnia and HerzegovinaBotswanaBrazilBrunei DarussalamBulgariaBurkina FasoBurundiCabo VerdeCambodiaCameroonCanadaCaribbean small statesCentral Europe and the BalticsChadChileChinaColombiaComorosCongo, Dem. Rep.Congo, Rep.Costa RicaCote d'IvoireCroatiaCubaCyprusCzech RepublicDenmarkDjiboutiDominican RepublicEarly-demographic dividendEast Asia & PacificEast Asia & Pacific (excluding high income)East Asia & Pacific (IDA & IBRD countries)EcuadorEgypt, Arab Rep.El SalvadorEquatorial GuineaEritreaEstoniaEthiopiaEuro areaEurope & Central AsiaEurope & Central Asia (excluding high income)Europe & Central Asia (IDA & IBRD countries)European UnionFijiFinlandFranceGabonGambia, TheGeorgiaGermanyGhanaGreeceGuatemalaGuineaGuinea-BissauHaitiHeavily indebted poor countries (HIPC)High incomeHondurasHong Kong SAR, ChinaHungaryIBRD onlyIcelandIDA & IBRD totalIDA blendIDA onlyIDA totalIndiaIndonesiaIran, Islamic Rep.IrelandIsraelItalyJamaicaJapanJordanKazakhstanKenyaKorea, Rep.KosovoKuwaitKyrgyz RepublicLao PDRLate-demographic dividendLatin America & Caribbean Latin America & Caribbean (excluding high income)Latin America & the Caribbean (IDA & IBRD countries)LatviaLeast developed countries: UN classificationLebanonLiberiaLibyaLithuaniaLow & middle incomeLow incomeLower middle incomeLuxembourgMacao SAR, ChinaMacedonia, FYRMadagascarMalawiMalaysiaMaliMaltaMauritaniaMauritiusMexicoMiddle East & North AfricaMiddle East & North Africa (excluding high income)Middle East & North Africa (IDA & IBRD countries)Middle incomeMoldovaMongoliaMontenegroMoroccoMozambiqueMyanmarNamibiaNepalNetherlandsNew ZealandNicaraguaNigerNigeriaNorth AmericaNorwayOECD membersOmanOther small statesPakistanPanamaPapua New GuineaParaguayPeruPhilippinesPolandPortugalPost-demographic dividendPre-demographic dividendPuerto RicoQatarRomaniaRussian FederationRwandaSamoaSaudi ArabiaSenegalSerbiaSeychellesSierra LeoneSingaporeSlovak RepublicSloveniaSmall statesSomaliaSouth AfricaSouth AsiaSouth Asia (IDA & IBRD)South SudanSpainSri LankaSub-Saharan Africa Sub-Saharan Africa (excluding high income)Sub-Saharan Africa (IDA & IBRD countries)SudanSurinameSwazilandSwedenSwitzerlandSyrian Arab RepublicTajikistanTanzaniaThailandTimor-LesteTogoTrinidad and TobagoTunisiaTurkeyTurkmenistanUgandaUkraineUnited Arab EmiratesUnited KingdomUnited StatesUpper middle incomeUruguayUzbekistanVanuatuVenezuela, RBVietnamWest Bank and GazaWorldZambiaZimbabwe línea de tiempo (timeline):
En esta escala de tiempo se presenta un gráfico de 1973 y 2014 de Puerto Rico. Los datos de 1972 están ausentes. El número de observaciones reales por fecha: 42.
Fuente (nombre):
Indicadores del desarrollo mundial
Fuente (organización):
World Bank national accounts data, and OECD National Accounts data files.
Categorías:
Economy & Growth
Se ha actualizado:
23 abr 2017 año
Los indicadores de los cambios de valor en los últimos años
Mínimo:
-10.683
1 ene 2011 año
Máximo:
16.067
1 ene 2013 año
A la fecha de observación
Valor
Cambio absoluto
El cambio con respecto al valor anterior
1 ene 1973 año
4.069
+4.069
0.0%
1 ene 1974 año
4.156
+0.087
2.13%
1 ene 1975 año
1.293
-2.863
-68.89%
1 ene 1976 año
-1.233
-2.525
-195.36%
1 ene 1977 año
0.939
+2.172
-176.19%
1 ene 1978 año
1.624
+0.685
72.97%
1 ene 1979 año
3.259
+1.635
100.65%
1 ene 1980 año
3.57
+0.311
9.54%
1 ene 1981 año
0.489
-3.081
-86.3%
1 ene 1982 año
0.563
+0.074
15.05%
1 ene 1983 año
-5.299
-5.862
-1.04 mil%
1 ene 1984 año
-2.639
+2.66
-50.2%
1 ene 1985 año
1.294
+3.933
-149.01%
1 ene 1986 año
1.561
+0.268
20.7%
1 ene 1987 año
1.786
+0.225
14.41%
1 ene 1988 año
1.099
-0.687
-38.47%
1 ene 1989 año
2.817
+1.718
156.29%
1 ene 1990 año
3.084
+0.267
9.49%
1 ene 1991 año
0.557
-2.527
-81.95%
1 ene 1992 año
1.274
+0.718
128.93%
1 ene 1993 año
-2.379
-3.653
-286.67%
1 ene 1994 año
4.427
+6.806
-286.07%
1 ene 1995 año
0.56
-3.866
-87.34%
1 ene 1996 año
0.87
+0.31
55.38%
1 ene 1997 año
3.773
+2.902
333.39%
1 ene 1998 año
4.041
+0.269
7.13%
1 ene 1999 año
-6.363
-10.404
-257.44%
1 ene 2000 año
5.293
+11.655
-183.18%
1 ene 2001 año
3.284
-2.009
-37.95%
1 ene 2002 año
-5.245
-8.529
-259.72%
1 ene 2003 año
-6.049
-0.804
15.33%
1 ene 2004 año
3.263
+9.312
-153.95%
1 ene 2005 año
-1.182
-4.445
-136.21%
1 ene 2006 año
-1.151
+0.03
-2.58%
1 ene 2007 año
-1.18
-0.029
2.49%
1 ene 2008 año
2.839
+4.019
-340.57%
1 ene 2009 año
-8.155
-10.993
-387.26%
1 ene 2010 año
-10.362
-2.208
27.07%
1 ene 2011 año
-10.683
-0.32
3.09%
1 ene 2012 año
-5.439
+5.243
-49.08%
1 ene 2013 año
16.067
+21.506
-395.4%
1 ene 2014 año
2.077
-13.99
-87.07%
Ranking de los países por los datos estadísticos actuales


Comentarios: