29
/es/
es
AIzaSyAYiBZKx7MnpbEhh9jyipgxe19OcubqV5w
April 1, 2024
67989
Angola
AGO
true
2
1
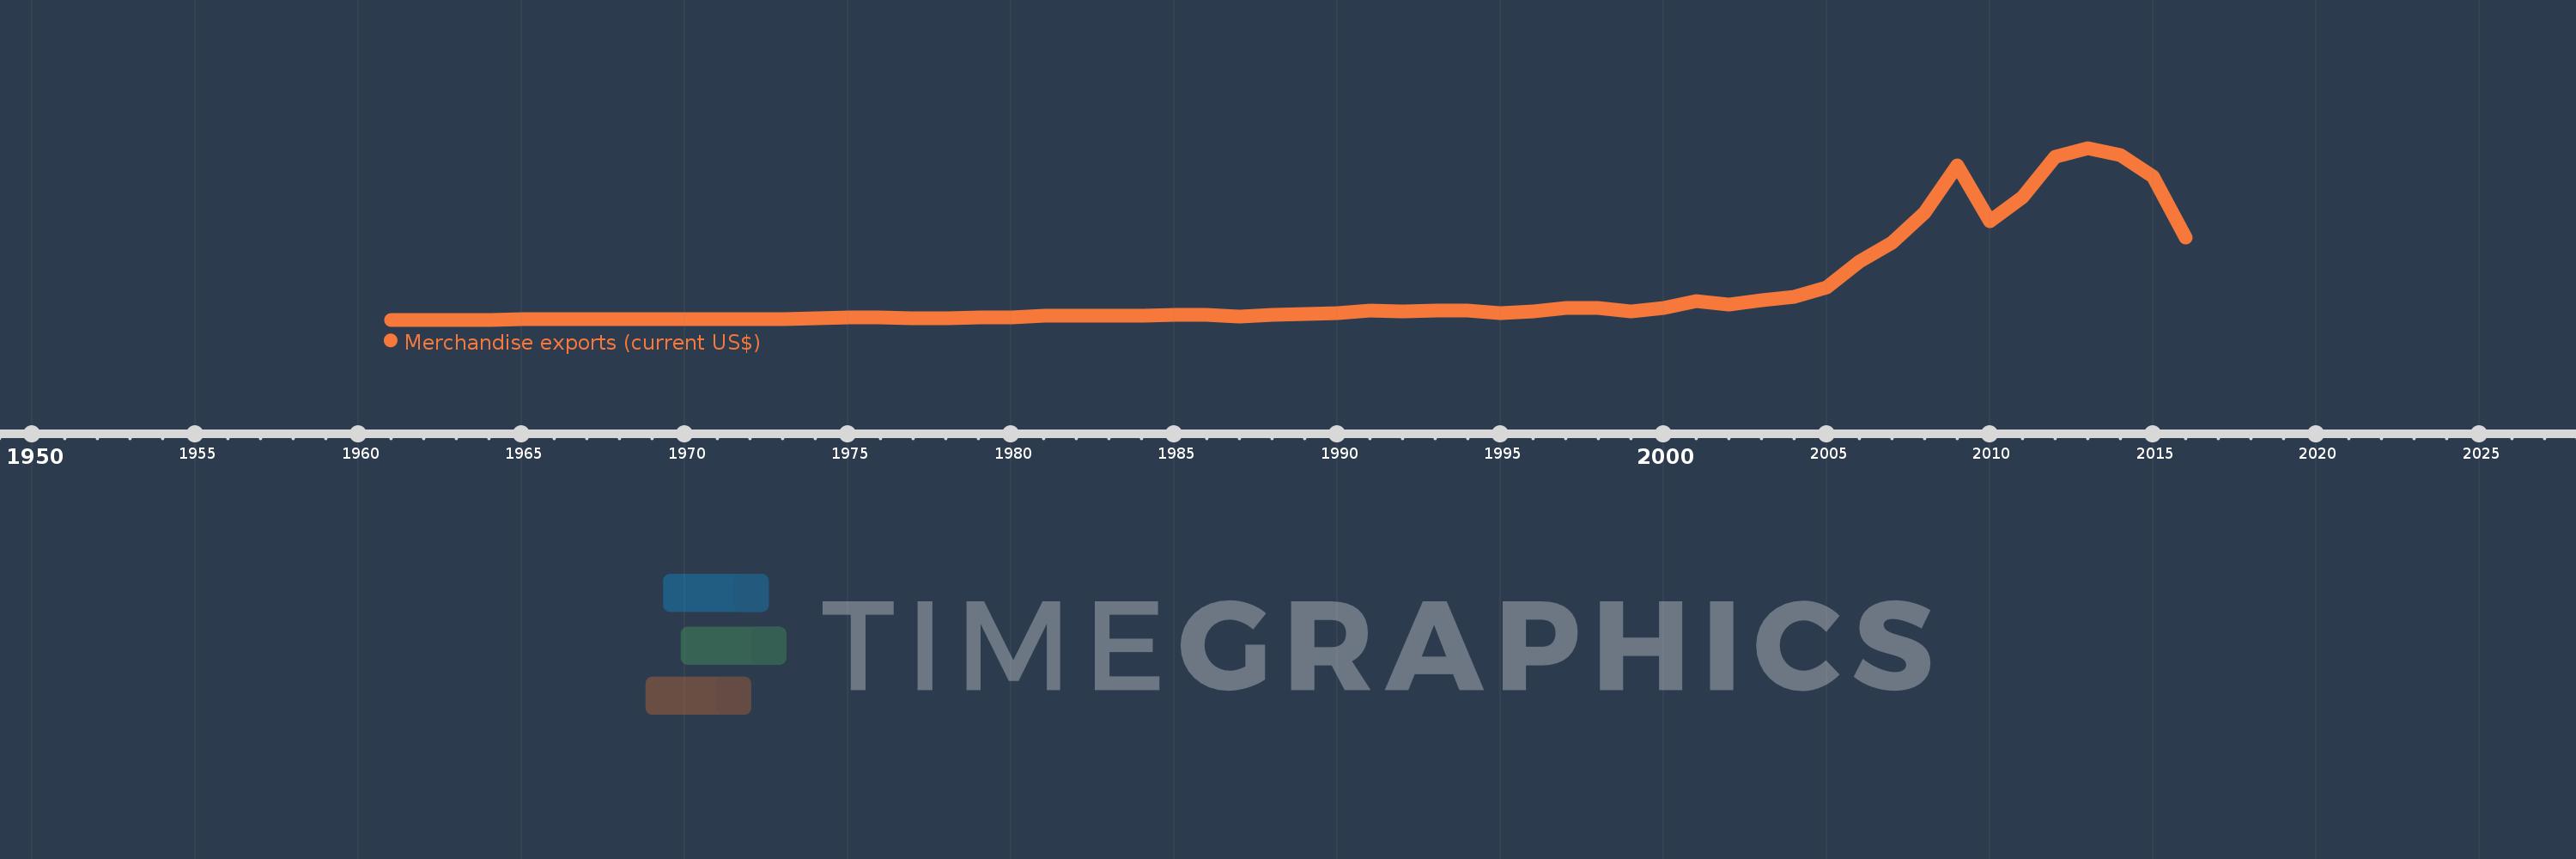
Merchandise exports (current US$)
2016,2015,2014,2013,2012,2011,2010,2009,2008,2007,2006,2005,2004,2003,2002,2001,2000,1999,1998,1997,1996,1995,1994,1993,1992,1991,1990,1989,1988,1987,1986,1985,1984,1983,1982,1981,1980,1979,1978,1977,1976,1975,1974,1973,1972,1971,1970,1969,1968,1967,1966,1965,1964,1963,1962,1961
Estas estadísticas en otros países:
AfghanistanAlbaniaAlgeriaAmerican SamoaAngolaAntigua and BarbudaArab WorldArgentinaArmeniaArubaAustraliaAustriaAzerbaijanBahamas, TheBahrainBangladeshBarbadosBelarusBelgiumBelizeBeninBermudaBhutanBoliviaBosnia and HerzegovinaBotswanaBrazilBrunei DarussalamBulgariaBurkina FasoBurundiCabo VerdeCambodiaCameroonCanadaCaribbean small statesCentral African RepublicCentral Europe and the BalticsChadChileChinaColombiaComorosCongo, Dem. Rep.Congo, Rep.Costa RicaCote d'IvoireCroatiaCubaCuracaoCyprusCzech RepublicDenmarkDjiboutiDominicaDominican RepublicEarly-demographic dividendEast Asia & PacificEast Asia & Pacific (excluding high income)East Asia & Pacific (IDA & IBRD countries)EcuadorEgypt, Arab Rep.El SalvadorEquatorial GuineaEritreaEstoniaEthiopiaEuro areaEurope & Central AsiaEurope & Central Asia (excluding high income)Europe & Central Asia (IDA & IBRD countries)European UnionFaroe IslandsFijiFinlandFragile and conflict affected situationsFranceFrench PolynesiaGabonGambia, TheGeorgiaGermanyGhanaGreeceGreenlandGrenadaGuamGuatemalaGuineaGuinea-BissauGuyanaHaitiHeavily indebted poor countries (HIPC)High incomeHondurasHong Kong SAR, ChinaHungaryIBRD onlyIcelandIDA & IBRD totalIDA blendIDA onlyIDA totalIndiaIndonesiaIran, Islamic Rep.IraqIrelandIsraelItalyJamaicaJapanJordanKazakhstanKenyaKiribatiKorea, Dem. People’s Rep.Korea, Rep.KuwaitKyrgyz RepublicLao PDRLate-demographic dividendLatin America & Caribbean Latin America & Caribbean (excluding high income)Latin America & the Caribbean (IDA & IBRD countries)LatviaLeast developed countries: UN classificationLebanonLesothoLiberiaLibyaLithuaniaLow & middle incomeLow incomeLower middle incomeLuxembourgMacao SAR, ChinaMacedonia, FYRMadagascarMalawiMalaysiaMaldivesMaliMaltaMarshall IslandsMauritaniaMauritiusMexicoMicronesia, Fed. Sts.Middle East & North AfricaMiddle East & North Africa (excluding high income)Middle East & North Africa (IDA & IBRD countries)Middle incomeMoldovaMongoliaMontenegroMoroccoMozambiqueMyanmarNamibiaNepalNetherlandsNew CaledoniaNew ZealandNicaraguaNigerNigeriaNorth AmericaNorthern Mariana IslandsNorwayOECD membersOmanOther small statesPacific island small statesPakistanPalauPanamaPapua New GuineaParaguayPeruPhilippinesPolandPortugalPost-demographic dividendPre-demographic dividendQatarRomaniaRussian FederationRwandaSamoaSao Tome and PrincipeSaudi ArabiaSenegalSerbiaSeychellesSierra LeoneSingaporeSint Maarten (Dutch part)Slovak RepublicSloveniaSmall statesSolomon IslandsSouth AfricaSouth AsiaSouth Asia (IDA & IBRD)SpainSri LankaSt. Kitts and NevisSt. LuciaSt. Martin (French part)St. Vincent and the GrenadinesSub-Saharan Africa Sub-Saharan Africa (excluding high income)Sub-Saharan Africa (IDA & IBRD countries)SudanSurinameSwazilandSwedenSwitzerlandSyrian Arab RepublicTajikistanTanzaniaThailandTimor-LesteTogoTongaTrinidad and TobagoTunisiaTurkeyTurkmenistanTuvaluUgandaUkraineUnited Arab EmiratesUnited KingdomUnited StatesUpper middle incomeUruguayUzbekistanVanuatuVenezuela, RBVietnamWorldYemen, Rep.ZambiaZimbabwe línea de tiempo (timeline):
En esta escala de tiempo se presenta un gráfico de 1961 y 2016 de Angola. Los datos de 1960 están ausentes. El número de observaciones reales por fecha: 56.
Fuente (nombre):
Indicadores del desarrollo mundial
Fuente (organización):
World Trade Organization.
Categorías:
Private Sector, Trade
Se ha actualizado:
23 abr 2017 año
Los indicadores de los cambios de valor en los últimos años
Mínimo:
124.0 millones
1 ene 1961 año
Máximo:
71.093 bn
1 ene 2013 año
A la fecha de observación
Valor
Cambio absoluto
El cambio con respecto al valor anterior
1 ene 1961 año
124.0 millones
+124.0 millones
0.0%
1 ene 1962 año
135.0 millones
+11.0 millones
8.87%
1 ene 1963 año
148.0 millones
+13.0 millones
9.63%
1 ene 1964 año
163.0 millones
+15.0 millones
10.14%
1 ene 1965 año
204.0 millones
+41.0 millones
25.15%
1 ene 1966 año
200.0 millones
-4.0 millones
-1.96%
1 ene 1967 año
221.0 millones
+21.0 millones
10.5%
1 ene 1968 año
238.0 millones
+17.0 millones
7.69%
1 ene 1969 año
271.0 millones
+33.0 millones
13.87%
1 ene 1970 año
326.0 millones
+55.0 millones
20.3%
1 ene 1971 año
423.0 millones
+97.0 millones
29.75%
1 ene 1972 año
455.0 millones
+32.0 millones
7.57%
1 ene 1973 año
479.0 millones
+24.0 millones
5.27%
1 ene 1974 año
792.0 millones
+313.0 millones
65.34%
1 ene 1975 año
1.202 bn
+410.0 millones
51.77%
1 ene 1976 año
1.012 bn
-190.0 millones
-15.81%
1 ene 1977 año
619.0 millones
-393.0 millones
-38.83%
1 ene 1978 año
786.0 millones
+167.0 millones
26.98%
1 ene 1979 año
968.0 millones
+182.0 millones
23.16%
1 ene 1980 año
1.091 bn
+123.0 millones
12.71%
1 ene 1981 año
1.883 bn
+792.0 millones
72.59%
1 ene 1982 año
1.856 bn
-27.0 millones
-1.43%
1 ene 1983 año
1.629 bn
-227.0 millones
-12.23%
1 ene 1984 año
1.822 bn
+193.0 millones
11.85%
1 ene 1985 año
2.033 bn
+211.0 millones
11.58%
1 ene 1986 año
2.245 bn
+212.0 millones
10.43%
1 ene 1987 año
1.332 bn
-913.0 millones
-40.67%
1 ene 1988 año
2.168 bn
+836.0 millones
62.76%
1 ene 1989 año
2.516 bn
+348.0 millones
16.05%
1 ene 1990 año
3.015 bn
+499.0 millones
19.83%
1 ene 1991 año
3.91 bn
+895.0 millones
29.68%
1 ene 1992 año
3.41 bn
-500.0 millones
-12.79%
1 ene 1993 año
3.755 bn
+345.0 millones
10.12%
1 ene 1994 año
3.762 bn
+7.0 millones
0.19%
1 ene 1995 año
3.018 bn
-744.0 millones
-19.78%
1 ene 1996 año
3.642 bn
+624.0 millones
20.68%
1 ene 1997 año
5.095 bn
+1.453 bn
39.9%
1 ene 1998 año
5.007 bn
-88.0 millones
-1.73%
1 ene 1999 año
3.543 bn
-1.464 bn
-29.24%
1 ene 2000 año
5.157 bn
+1.614 bn
45.55%
1 ene 2001 año
7.921 bn
+2.764 bn
53.6%
1 ene 2002 año
6.534 bn
-1.387 bn
-17.51%
1 ene 2003 año
8.328 bn
+1.794 bn
27.46%
1 ene 2004 año
9.508 bn
+1.18 bn
14.17%
1 ene 2005 año
13.475 bn
+3.967 bn
41.72%
1 ene 2006 año
24.109 bn
+10.634 bn
78.92%
1 ene 2007 año
31.862 bn
+7.753 bn
32.16%
1 ene 2008 año
44.396 bn
+12.534 bn
39.34%
1 ene 2009 año
63.914 bn
+19.518 bn
43.96%
1 ene 2010 año
40.828 bn
-23.086 bn
-36.12%
1 ene 2011 año
50.595 bn
+9.767 bn
23.92%
1 ene 2012 año
67.31 bn
+16.715 bn
33.04%
1 ene 2013 año
71.093 bn
+3.783 bn
5.62%
1 ene 2014 año
68.247 bn
-2.847 bn
-4.0%
1 ene 2015 año
59.17 bn
-9.077 bn
-13.3%
1 ene 2016 año
34.151 bn
-25.018 bn
-42.28%
Ranking de los países por los datos estadísticos actuales


Comentarios: