29
/es/
es
AIzaSyAYiBZKx7MnpbEhh9jyipgxe19OcubqV5w
April 1, 2024
105133
Chile
CHL
true
2
1
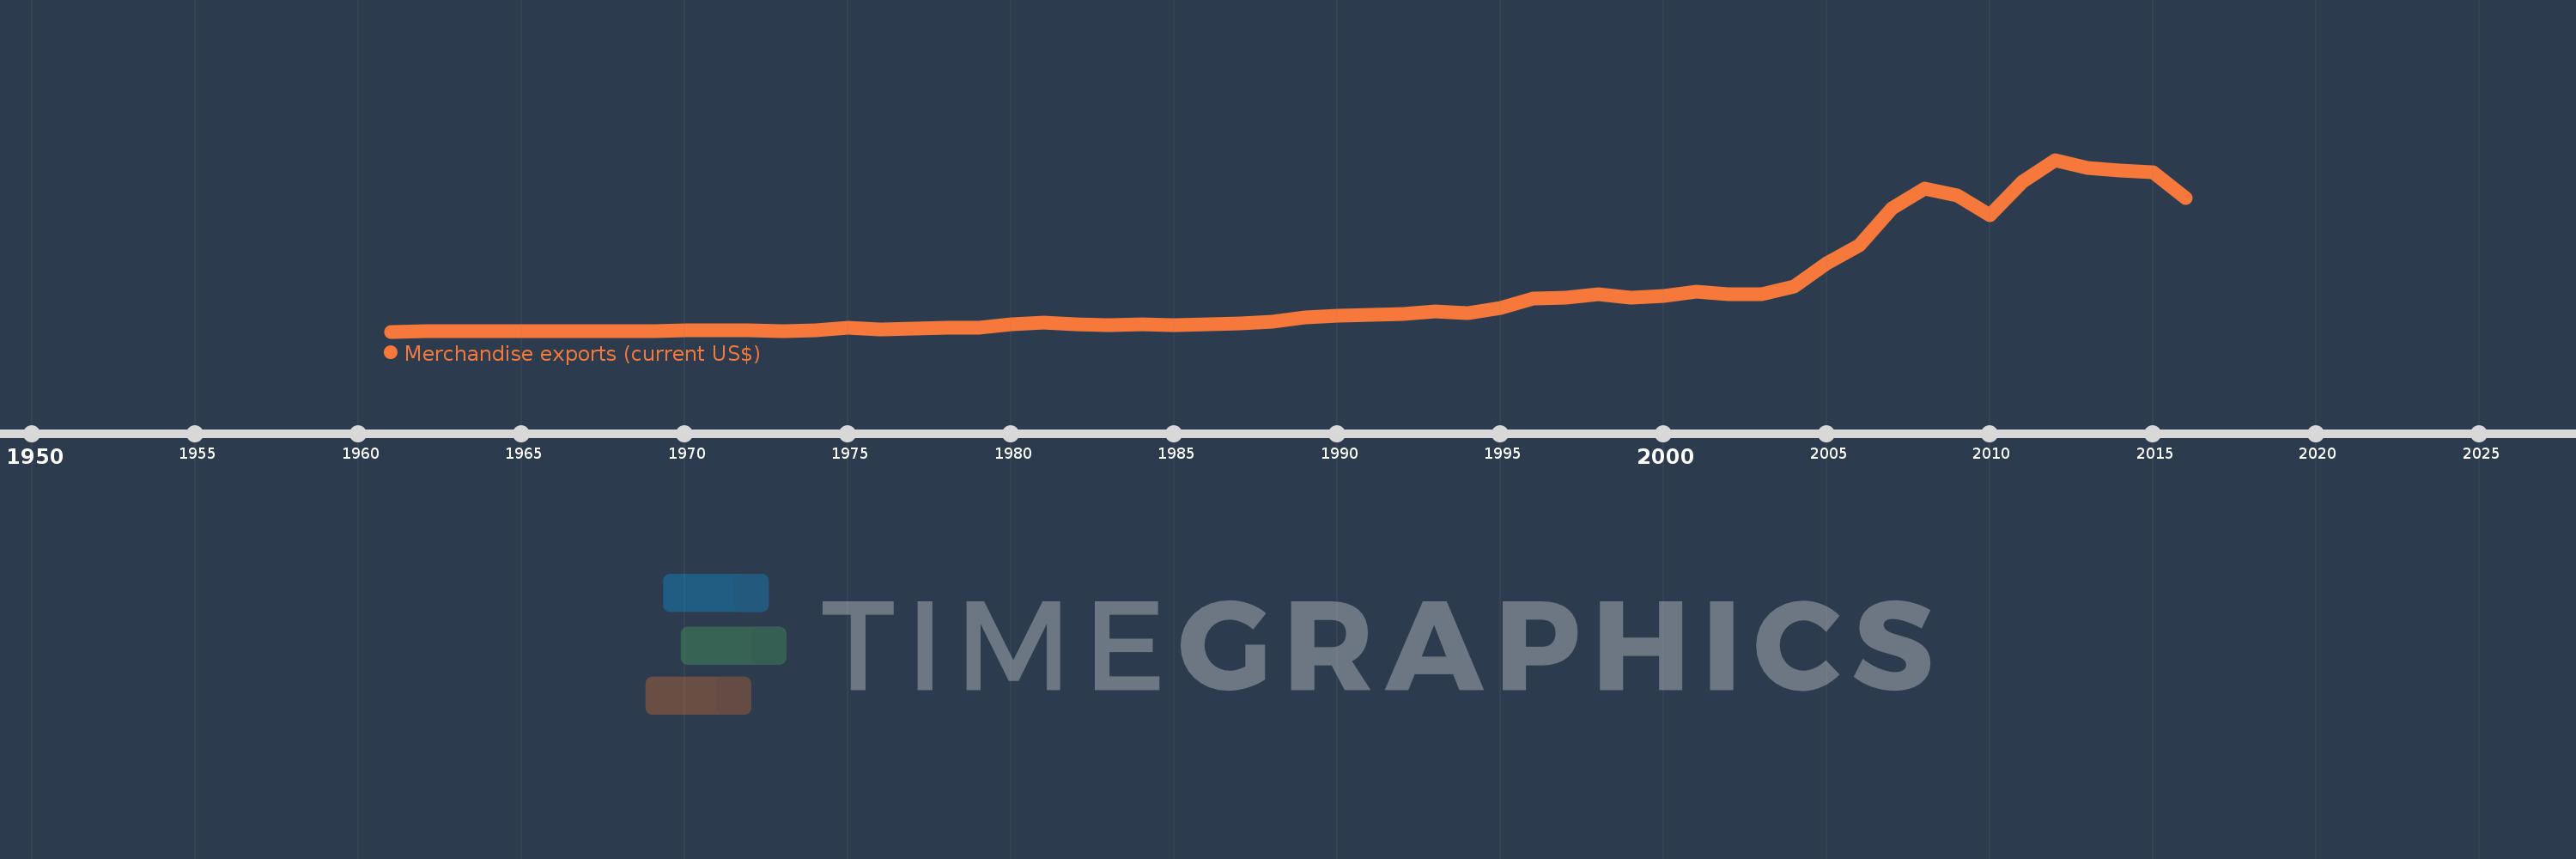
Merchandise exports (current US$)
2016,2015,2014,2013,2012,2011,2010,2009,2008,2007,2006,2005,2004,2003,2002,2001,2000,1999,1998,1997,1996,1995,1994,1993,1992,1991,1990,1989,1988,1987,1986,1985,1984,1983,1982,1981,1980,1979,1978,1977,1976,1975,1974,1973,1972,1971,1970,1969,1968,1967,1966,1965,1964,1963,1962,1961
Estas estadísticas en otros países:
AfghanistanAlbaniaAlgeriaAmerican SamoaAngolaAntigua and BarbudaArab WorldArgentinaArmeniaArubaAustraliaAustriaAzerbaijanBahamas, TheBahrainBangladeshBarbadosBelarusBelgiumBelizeBeninBermudaBhutanBoliviaBosnia and HerzegovinaBotswanaBrazilBrunei DarussalamBulgariaBurkina FasoBurundiCabo VerdeCambodiaCameroonCanadaCaribbean small statesCentral African RepublicCentral Europe and the BalticsChadChileChinaColombiaComorosCongo, Dem. Rep.Congo, Rep.Costa RicaCote d'IvoireCroatiaCubaCuracaoCyprusCzech RepublicDenmarkDjiboutiDominicaDominican RepublicEarly-demographic dividendEast Asia & PacificEast Asia & Pacific (excluding high income)East Asia & Pacific (IDA & IBRD countries)EcuadorEgypt, Arab Rep.El SalvadorEquatorial GuineaEritreaEstoniaEthiopiaEuro areaEurope & Central AsiaEurope & Central Asia (excluding high income)Europe & Central Asia (IDA & IBRD countries)European UnionFaroe IslandsFijiFinlandFragile and conflict affected situationsFranceFrench PolynesiaGabonGambia, TheGeorgiaGermanyGhanaGreeceGreenlandGrenadaGuamGuatemalaGuineaGuinea-BissauGuyanaHaitiHeavily indebted poor countries (HIPC)High incomeHondurasHong Kong SAR, ChinaHungaryIBRD onlyIcelandIDA & IBRD totalIDA blendIDA onlyIDA totalIndiaIndonesiaIran, Islamic Rep.IraqIrelandIsraelItalyJamaicaJapanJordanKazakhstanKenyaKiribatiKorea, Dem. People’s Rep.Korea, Rep.KuwaitKyrgyz RepublicLao PDRLate-demographic dividendLatin America & Caribbean Latin America & Caribbean (excluding high income)Latin America & the Caribbean (IDA & IBRD countries)LatviaLeast developed countries: UN classificationLebanonLesothoLiberiaLibyaLithuaniaLow & middle incomeLow incomeLower middle incomeLuxembourgMacao SAR, ChinaMacedonia, FYRMadagascarMalawiMalaysiaMaldivesMaliMaltaMarshall IslandsMauritaniaMauritiusMexicoMicronesia, Fed. Sts.Middle East & North AfricaMiddle East & North Africa (excluding high income)Middle East & North Africa (IDA & IBRD countries)Middle incomeMoldovaMongoliaMontenegroMoroccoMozambiqueMyanmarNamibiaNepalNetherlandsNew CaledoniaNew ZealandNicaraguaNigerNigeriaNorth AmericaNorthern Mariana IslandsNorwayOECD membersOmanOther small statesPacific island small statesPakistanPalauPanamaPapua New GuineaParaguayPeruPhilippinesPolandPortugalPost-demographic dividendPre-demographic dividendQatarRomaniaRussian FederationRwandaSamoaSao Tome and PrincipeSaudi ArabiaSenegalSerbiaSeychellesSierra LeoneSingaporeSint Maarten (Dutch part)Slovak RepublicSloveniaSmall statesSolomon IslandsSouth AfricaSouth AsiaSouth Asia (IDA & IBRD)SpainSri LankaSt. Kitts and NevisSt. LuciaSt. Martin (French part)St. Vincent and the GrenadinesSub-Saharan Africa Sub-Saharan Africa (excluding high income)Sub-Saharan Africa (IDA & IBRD countries)SudanSurinameSwazilandSwedenSwitzerlandSyrian Arab RepublicTajikistanTanzaniaThailandTimor-LesteTogoTongaTrinidad and TobagoTunisiaTurkeyTurkmenistanTuvaluUgandaUkraineUnited Arab EmiratesUnited KingdomUnited StatesUpper middle incomeUruguayUzbekistanVanuatuVenezuela, RBVietnamWorldYemen, Rep.ZambiaZimbabwe línea de tiempo (timeline):
En esta escala de tiempo se presenta un gráfico de 1961 y 2016 de Chile. Los datos de 1960 están ausentes. El número de observaciones reales por fecha: 56.
Fuente (nombre):
Indicadores del desarrollo mundial
Fuente (organización):
World Trade Organization.
Categorías:
Private Sector, Trade
Se ha actualizado:
23 abr 2017 año
Los indicadores de los cambios de valor en los últimos años
Mínimo:
488.1 millones
1 ene 1961 año
Máximo:
81.438 bn
1 ene 2012 año
A la fecha de observación
Valor
Cambio absoluto
El cambio con respecto al valor anterior
1 ene 1961 año
488.1 millones
+488.1 millones
0.0%
1 ene 1962 año
506.3 millones
+18.2 millones
3.73%
1 ene 1963 año
530.1 millones
+23.8 millones
4.7%
1 ene 1964 año
521.5 millones
-8.6 millones
-1.62%
1 ene 1965 año
592.1 millones
+70.6 millones
13.54%
1 ene 1966 año
637.4 millones
+45.3 millones
7.65%
1 ene 1967 año
817.1 millones
+179.7 millones
28.19%
1 ene 1968 año
847.4 millones
+30.3 millones
3.71%
1 ene 1969 año
858.0 millones
+10.6 millones
1.25%
1 ene 1970 año
1.075 bn
+217.4 millones
25.34%
1 ene 1971 año
1.249 bn
+173.2 millones
16.11%
1 ene 1972 año
996.8 millones
-251.8 millones
-20.17%
1 ene 1973 año
855.4 millones
-141.4 millones
-14.19%
1 ene 1974 año
1.23 bn
+375.1 millones
43.85%
1 ene 1975 año
2.481 bn
+1.25 bn
101.58%
1 ene 1976 año
1.552 bn
-928.4 millones
-37.43%
1 ene 1977 año
2.083 bn
+530.5 millones
34.18%
1 ene 1978 año
2.19 bn
+107.7 millones
5.17%
1 ene 1979 año
2.478 bn
+287.4 millones
13.12%
1 ene 1980 año
3.894 bn
+1.417 bn
57.17%
1 ene 1981 año
4.705 bn
+810.8 millones
20.82%
1 ene 1982 año
3.836 bn
-869.0 millones
-18.47%
1 ene 1983 año
3.705 bn
-131.0 millones
-3.42%
1 ene 1984 año
3.83 bn
+125.0 millones
3.37%
1 ene 1985 año
3.65 bn
-180.0 millones
-4.7%
1 ene 1986 año
3.804 bn
+154.0 millones
4.22%
1 ene 1987 año
4.191 bn
+387.0 millones
10.17%
1 ene 1988 año
5.224 bn
+1.033 bn
24.65%
1 ene 1989 año
7.052 bn
+1.828 bn
34.99%
1 ene 1990 año
8.08 bn
+1.028 bn
14.58%
1 ene 1991 año
8.372 bn
+292.0 millones
3.61%
1 ene 1992 año
8.941 bn
+569.0 millones
6.8%
1 ene 1993 año
10.007 bn
+1.066 bn
11.92%
1 ene 1994 año
9.198 bn
-809.0 millones
-8.08%
1 ene 1995 año
11.604 bn
+2.406 bn
26.16%
1 ene 1996 año
16.024 bn
+4.42 bn
38.09%
1 ene 1997 año
16.627 bn
+603.0 millones
3.76%
1 ene 1998 año
17.902 bn
+1.275 bn
7.67%
1 ene 1999 año
16.323 bn
-1.579 bn
-8.82%
1 ene 2000 año
17.162 bn
+839.0 millones
5.14%
1 ene 2001 año
19.21 bn
+2.048 bn
11.93%
1 ene 2002 año
18.272 bn
-938.0 millones
-4.88%
1 ene 2003 año
18.18 bn
-92.0 millones
-0.5%
1 ene 2004 año
21.664 bn
+3.484 bn
19.16%
1 ene 2005 año
32.52 bn
+10.856 bn
50.11%
1 ene 2006 año
41.267 bn
+8.747 bn
26.9%
1 ene 2007 año
58.68 bn
+17.413 bn
42.2%
1 ene 2008 año
67.972 bn
+9.292 bn
15.83%
1 ene 2009 año
64.51 bn
-3.461 bn
-5.09%
1 ene 2010 año
55.463 bn
-9.047 bn
-14.02%
1 ene 2011 año
71.109 bn
+15.646 bn
28.21%
1 ene 2012 año
81.438 bn
+10.329 bn
14.53%
1 ene 2013 año
77.791 bn
-3.647 bn
-4.48%
1 ene 2014 año
76.477 bn
-1.314 bn
-1.69%
1 ene 2015 año
75.675 bn
-802.153 millones
-1.05%
1 ene 2016 año
63.362 bn
-12.313 bn
-16.27%
Ranking de los países por los datos estadísticos actuales


Comentarios: