29
/es/
es
AIzaSyAYiBZKx7MnpbEhh9jyipgxe19OcubqV5w
April 1, 2024
54973
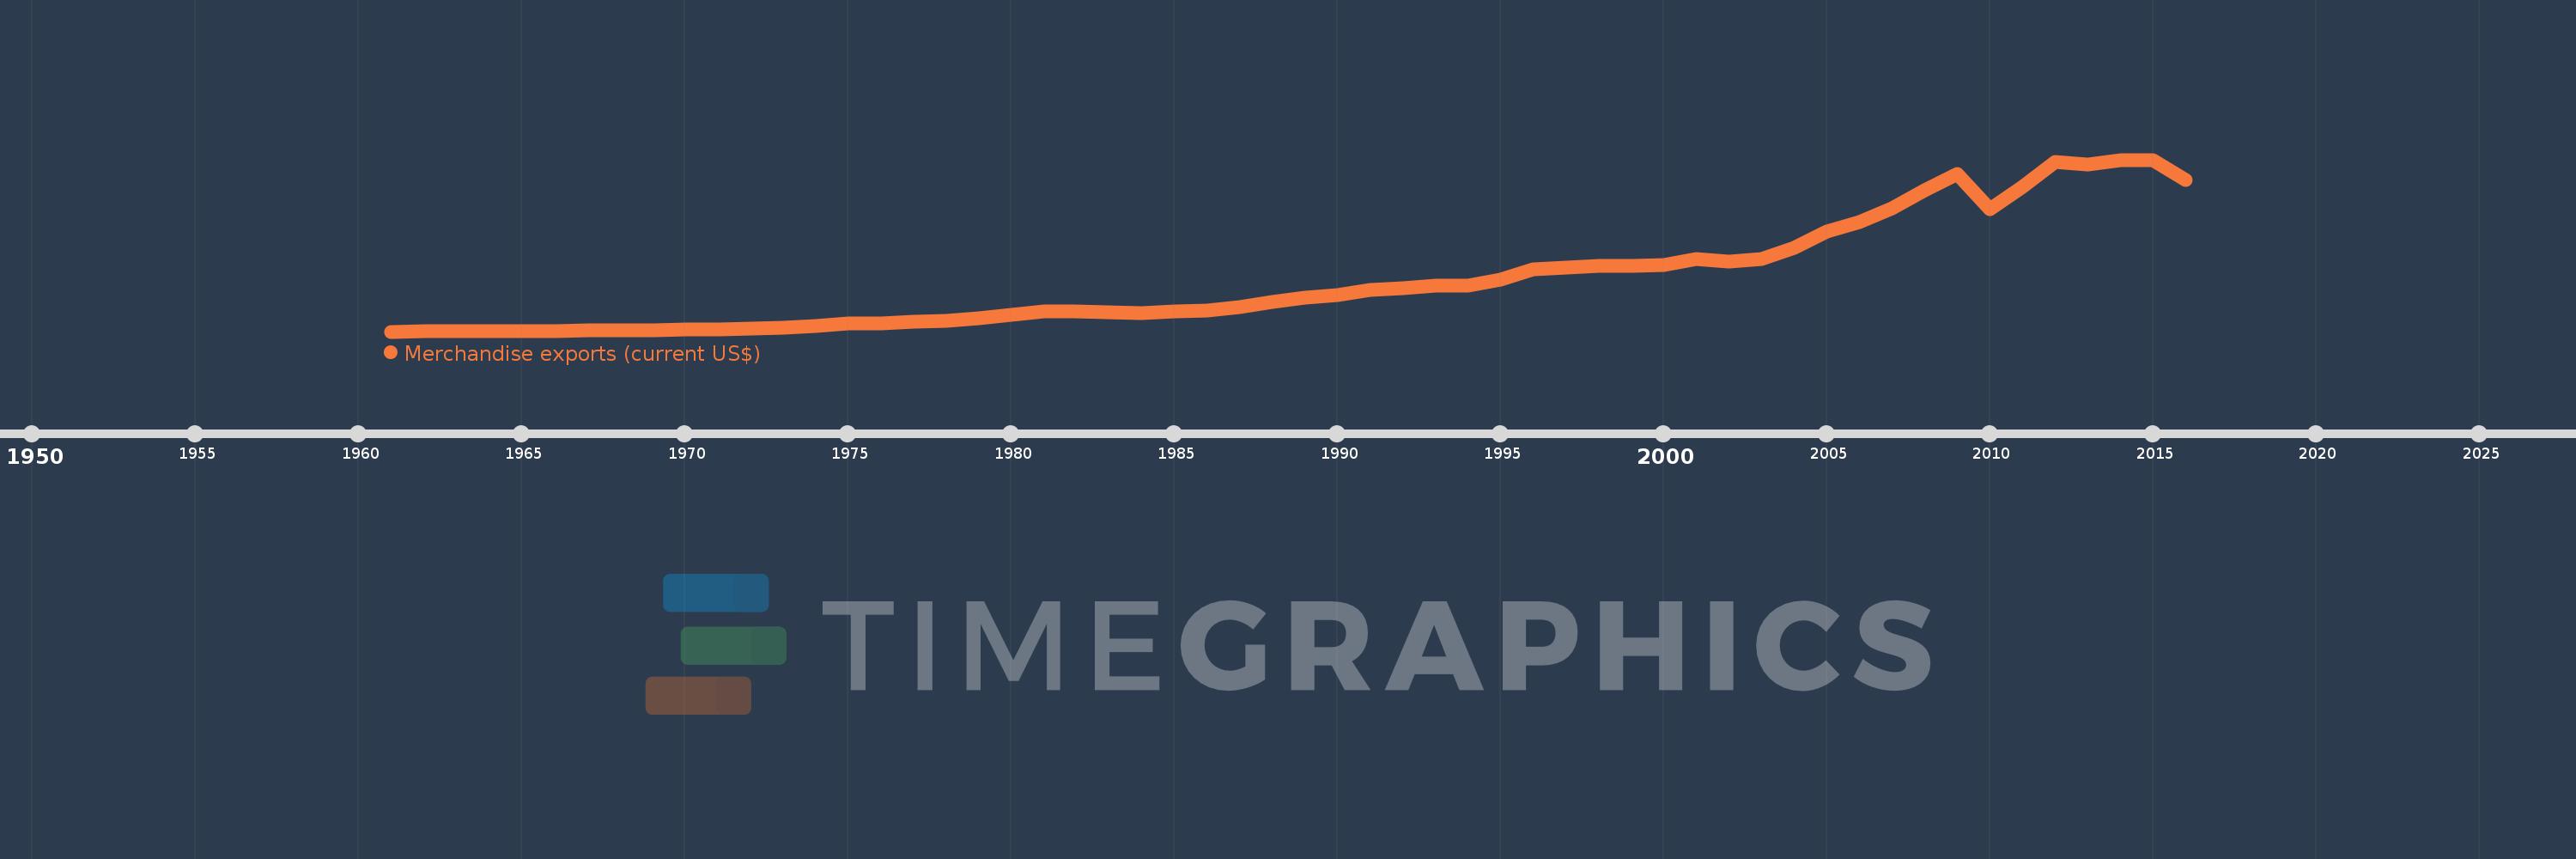
Post-demographic dividend
PST
false
2
1
Merchandise exports (current US$)
2016,2015,2014,2013,2012,2011,2010,2009,2008,2007,2006,2005,2004,2003,2002,2001,2000,1999,1998,1997,1996,1995,1994,1993,1992,1991,1990,1989,1988,1987,1986,1985,1984,1983,1982,1981,1980,1979,1978,1977,1976,1975,1974,1973,1972,1971,1970,1969,1968,1967,1966,1965,1964,1963,1962,1961
Estas estadísticas en otros países:
AfghanistanAlbaniaAlgeriaAmerican SamoaAngolaAntigua and BarbudaArab WorldArgentinaArmeniaArubaAustraliaAustriaAzerbaijanBahamas, TheBahrainBangladeshBarbadosBelarusBelgiumBelizeBeninBermudaBhutanBoliviaBosnia and HerzegovinaBotswanaBrazilBrunei DarussalamBulgariaBurkina FasoBurundiCabo VerdeCambodiaCameroonCanadaCaribbean small statesCentral African RepublicCentral Europe and the BalticsChadChileChinaColombiaComorosCongo, Dem. Rep.Congo, Rep.Costa RicaCote d'IvoireCroatiaCubaCuracaoCyprusCzech RepublicDenmarkDjiboutiDominicaDominican RepublicEarly-demographic dividendEast Asia & PacificEast Asia & Pacific (excluding high income)East Asia & Pacific (IDA & IBRD countries)EcuadorEgypt, Arab Rep.El SalvadorEquatorial GuineaEritreaEstoniaEthiopiaEuro areaEurope & Central AsiaEurope & Central Asia (excluding high income)Europe & Central Asia (IDA & IBRD countries)European UnionFaroe IslandsFijiFinlandFragile and conflict affected situationsFranceFrench PolynesiaGabonGambia, TheGeorgiaGermanyGhanaGreeceGreenlandGrenadaGuamGuatemalaGuineaGuinea-BissauGuyanaHaitiHeavily indebted poor countries (HIPC)High incomeHondurasHong Kong SAR, ChinaHungaryIBRD onlyIcelandIDA & IBRD totalIDA blendIDA onlyIDA totalIndiaIndonesiaIran, Islamic Rep.IraqIrelandIsraelItalyJamaicaJapanJordanKazakhstanKenyaKiribatiKorea, Dem. People’s Rep.Korea, Rep.KuwaitKyrgyz RepublicLao PDRLate-demographic dividendLatin America & Caribbean Latin America & Caribbean (excluding high income)Latin America & the Caribbean (IDA & IBRD countries)LatviaLeast developed countries: UN classificationLebanonLesothoLiberiaLibyaLithuaniaLow & middle incomeLow incomeLower middle incomeLuxembourgMacao SAR, ChinaMacedonia, FYRMadagascarMalawiMalaysiaMaldivesMaliMaltaMarshall IslandsMauritaniaMauritiusMexicoMicronesia, Fed. Sts.Middle East & North AfricaMiddle East & North Africa (excluding high income)Middle East & North Africa (IDA & IBRD countries)Middle incomeMoldovaMongoliaMontenegroMoroccoMozambiqueMyanmarNamibiaNepalNetherlandsNew CaledoniaNew ZealandNicaraguaNigerNigeriaNorth AmericaNorthern Mariana IslandsNorwayOECD membersOmanOther small statesPacific island small statesPakistanPalauPanamaPapua New GuineaParaguayPeruPhilippinesPolandPortugalPost-demographic dividendPre-demographic dividendQatarRomaniaRussian FederationRwandaSamoaSao Tome and PrincipeSaudi ArabiaSenegalSerbiaSeychellesSierra LeoneSingaporeSint Maarten (Dutch part)Slovak RepublicSloveniaSmall statesSolomon IslandsSouth AfricaSouth AsiaSouth Asia (IDA & IBRD)SpainSri LankaSt. Kitts and NevisSt. LuciaSt. Martin (French part)St. Vincent and the GrenadinesSub-Saharan Africa Sub-Saharan Africa (excluding high income)Sub-Saharan Africa (IDA & IBRD countries)SudanSurinameSwazilandSwedenSwitzerlandSyrian Arab RepublicTajikistanTanzaniaThailandTimor-LesteTogoTongaTrinidad and TobagoTunisiaTurkeyTurkmenistanTuvaluUgandaUkraineUnited Arab EmiratesUnited KingdomUnited StatesUpper middle incomeUruguayUzbekistanVanuatuVenezuela, RBVietnamWorldYemen, Rep.ZambiaZimbabwe línea de tiempo (timeline):
En esta escala de tiempo se presenta un gráfico de 1961 y 2016 de Post-demographic dividend. Los datos de 1960 están ausentes. El número de observaciones reales por fecha: 56.
Fuente (nombre):
Indicadores del desarrollo mundial
Fuente (organización):
World Trade Organization.
Categorías:
Private Sector, Trade
Se ha actualizado:
23 abr 2017 año
Los indicadores de los cambios de valor en los últimos años
En promedio:
3.324 billones
Mínimo:
89.74 bn
1 ene 1961 año
Máximo:
10.761 billones
1 ene 2015 año
A la fecha de observación
Valor
Cambio absoluto
El cambio con respecto al valor anterior
1 ene 1961 año
89.74 bn
+89.74 bn
0.0%
1 ene 1962 año
94.837 bn
+5.097 bn
5.68%
1 ene 1963 año
99.598 bn
+4.761 bn
5.02%
1 ene 1964 año
108.792 bn
+9.194 bn
9.23%
1 ene 1965 año
123.074 bn
+14.281 bn
13.13%
1 ene 1966 año
134.547 bn
+11.473 bn
9.32%
1 ene 1967 año
148.434 bn
+13.887 bn
10.32%
1 ene 1968 año
156.864 bn
+8.43 bn
5.68%
1 ene 1969 año
176.548 bn
+19.685 bn
12.55%
1 ene 1970 año
203.826 bn
+27.278 bn
15.45%
1 ene 1971 año
235.876 bn
+32.05 bn
15.72%
1 ene 1972 año
263.301 bn
+27.425 bn
11.63%
1 ene 1973 año
314.244 bn
+50.944 bn
19.35%
1 ene 1974 año
430.823 bn
+116.579 bn
37.1%
1 ene 1975 año
575.365 bn
+144.542 bn
33.55%
1 ene 1976 año
614.576 bn
+39.21 bn
6.81%
1 ene 1977 año
686.77 bn
+72.194 bn
11.75%
1 ene 1978 año
780.422 bn
+93.653 bn
13.64%
1 ene 1979 año
933.667 bn
+153.245 bn
19.64%
1 ene 1980 año
1.15 billones
+216.302 bn
23.17%
1 ene 1981 año
1.347 billones
+197.358 bn
17.16%
1 ene 1982 año
1.334 billones
-13.049 bn
-0.97%
1 ene 1983 año
1.269 billones
-65.316 bn
-4.9%
1 ene 1984 año
1.26 billones
-9.093 bn
-0.72%
1 ene 1985 año
1.351 billones
+91.423 bn
7.26%
1 ene 1986 año
1.394 billones
+42.561 bn
3.15%
1 ene 1987 año
1.62 billones
+225.721 bn
16.19%
1 ene 1988 año
1.904 billones
+284.357 bn
17.56%
1 ene 1989 año
2.197 billones
+293.325 bn
15.41%
1 ene 1990 año
2.355 billones
+158.182 bn
7.2%
1 ene 1991 año
2.703 billones
+347.756 bn
14.76%
1 ene 1992 año
2.769 billones
+65.507 bn
2.42%
1 ene 1993 año
2.954 billones
+184.941 bn
6.68%
1 ene 1994 año
2.933 billones
-20.803 bn
-0.7%
1 ene 1995 año
3.321 billones
+388.278 bn
13.24%
1 ene 1996 año
3.953 billones
+632.192 bn
19.04%
1 ene 1997 año
4.077 billones
+123.967 bn
3.14%
1 ene 1998 año
4.162 billones
+84.688 bn
2.08%
1 ene 1999 año
4.163 billones
+568.386 millones
0.01%
1 ene 2000 año
4.241 billones
+78.322 bn
1.88%
1 ene 2001 año
4.616 billones
+375.36 bn
8.85%
1 ene 2002 año
4.429 billones
-187.022 bn
-4.05%
1 ene 2003 año
4.593 billones
+163.335 bn
3.69%
1 ene 2004 año
5.312 billones
+719.605 bn
15.67%
1 ene 2005 año
6.31 billones
+997.65 bn
18.78%
1 ene 2006 año
6.892 billones
+581.954 bn
9.22%
1 ene 2007 año
7.759 billones
+867.125 bn
12.58%
1 ene 2008 año
8.847 billones
+1.088 billones
14.02%
1 ene 2009 año
9.866 billones
+1.019 billones
11.52%
1 ene 2010 año
7.694 billones
-2.172 billones
-22.01%
1 ene 2011 año
9.084 billones
+1.389 billones
18.06%
1 ene 2012 año
10.609 billones
+1.525 billones
16.79%
1 ene 2013 año
10.48 billones
-128.97 bn
-1.22%
1 ene 2014 año
10.749 billones
+269.512 bn
2.57%
1 ene 2015 año
10.761 billones
+11.45 bn
0.11%
1 ene 2016 año
9.526 billones
-1.235 billones
-11.48%
Ranking de los países por los datos estadísticos actuales


Comentarios: