29
/es/
es
AIzaSyAYiBZKx7MnpbEhh9jyipgxe19OcubqV5w
April 1, 2024
66272
Algeria
DZA
true
2
1
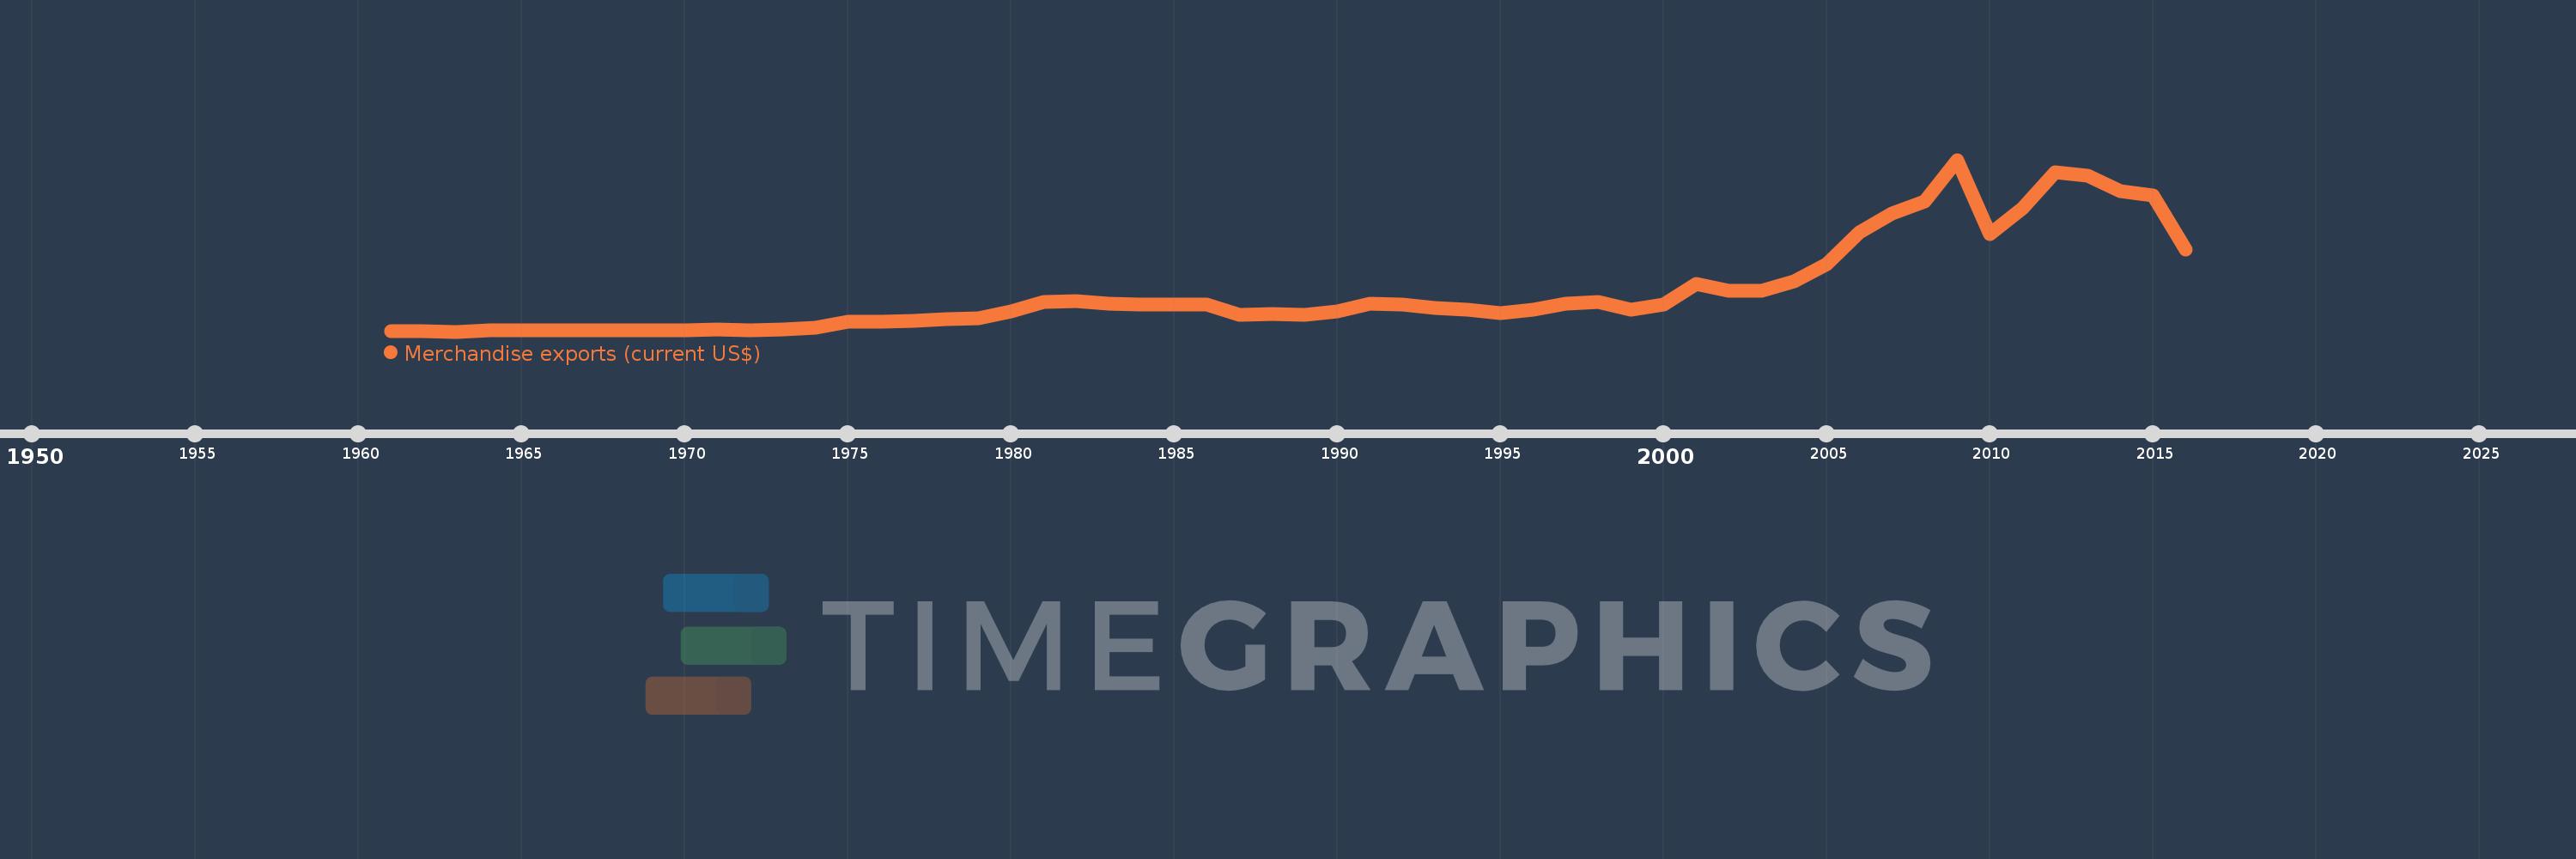
Merchandise exports (current US$)
2016,2015,2014,2013,2012,2011,2010,2009,2008,2007,2006,2005,2004,2003,2002,2001,2000,1999,1998,1997,1996,1995,1994,1993,1992,1991,1990,1989,1988,1987,1986,1985,1984,1983,1982,1981,1980,1979,1978,1977,1976,1975,1974,1973,1972,1971,1970,1969,1968,1967,1966,1965,1964,1963,1962,1961
Estas estadísticas en otros países:
AfghanistanAlbaniaAlgeriaAmerican SamoaAngolaAntigua and BarbudaArab WorldArgentinaArmeniaArubaAustraliaAustriaAzerbaijanBahamas, TheBahrainBangladeshBarbadosBelarusBelgiumBelizeBeninBermudaBhutanBoliviaBosnia and HerzegovinaBotswanaBrazilBrunei DarussalamBulgariaBurkina FasoBurundiCabo VerdeCambodiaCameroonCanadaCaribbean small statesCentral African RepublicCentral Europe and the BalticsChadChileChinaColombiaComorosCongo, Dem. Rep.Congo, Rep.Costa RicaCote d'IvoireCroatiaCubaCuracaoCyprusCzech RepublicDenmarkDjiboutiDominicaDominican RepublicEarly-demographic dividendEast Asia & PacificEast Asia & Pacific (excluding high income)East Asia & Pacific (IDA & IBRD countries)EcuadorEgypt, Arab Rep.El SalvadorEquatorial GuineaEritreaEstoniaEthiopiaEuro areaEurope & Central AsiaEurope & Central Asia (excluding high income)Europe & Central Asia (IDA & IBRD countries)European UnionFaroe IslandsFijiFinlandFragile and conflict affected situationsFranceFrench PolynesiaGabonGambia, TheGeorgiaGermanyGhanaGreeceGreenlandGrenadaGuamGuatemalaGuineaGuinea-BissauGuyanaHaitiHeavily indebted poor countries (HIPC)High incomeHondurasHong Kong SAR, ChinaHungaryIBRD onlyIcelandIDA & IBRD totalIDA blendIDA onlyIDA totalIndiaIndonesiaIran, Islamic Rep.IraqIrelandIsraelItalyJamaicaJapanJordanKazakhstanKenyaKiribatiKorea, Dem. People’s Rep.Korea, Rep.KuwaitKyrgyz RepublicLao PDRLate-demographic dividendLatin America & Caribbean Latin America & Caribbean (excluding high income)Latin America & the Caribbean (IDA & IBRD countries)LatviaLeast developed countries: UN classificationLebanonLesothoLiberiaLibyaLithuaniaLow & middle incomeLow incomeLower middle incomeLuxembourgMacao SAR, ChinaMacedonia, FYRMadagascarMalawiMalaysiaMaldivesMaliMaltaMarshall IslandsMauritaniaMauritiusMexicoMicronesia, Fed. Sts.Middle East & North AfricaMiddle East & North Africa (excluding high income)Middle East & North Africa (IDA & IBRD countries)Middle incomeMoldovaMongoliaMontenegroMoroccoMozambiqueMyanmarNamibiaNepalNetherlandsNew CaledoniaNew ZealandNicaraguaNigerNigeriaNorth AmericaNorthern Mariana IslandsNorwayOECD membersOmanOther small statesPacific island small statesPakistanPalauPanamaPapua New GuineaParaguayPeruPhilippinesPolandPortugalPost-demographic dividendPre-demographic dividendQatarRomaniaRussian FederationRwandaSamoaSao Tome and PrincipeSaudi ArabiaSenegalSerbiaSeychellesSierra LeoneSingaporeSint Maarten (Dutch part)Slovak RepublicSloveniaSmall statesSolomon IslandsSouth AfricaSouth AsiaSouth Asia (IDA & IBRD)SpainSri LankaSt. Kitts and NevisSt. LuciaSt. Martin (French part)St. Vincent and the GrenadinesSub-Saharan Africa Sub-Saharan Africa (excluding high income)Sub-Saharan Africa (IDA & IBRD countries)SudanSurinameSwazilandSwedenSwitzerlandSyrian Arab RepublicTajikistanTanzaniaThailandTimor-LesteTogoTongaTrinidad and TobagoTunisiaTurkeyTurkmenistanTuvaluUgandaUkraineUnited Arab EmiratesUnited KingdomUnited StatesUpper middle incomeUruguayUzbekistanVanuatuVenezuela, RBVietnamWorldYemen, Rep.ZambiaZimbabwe línea de tiempo (timeline):
En esta escala de tiempo se presenta un gráfico de 1961 y 2016 de Algeria. Los datos de 1960 están ausentes. El número de observaciones reales por fecha: 56.
Fuente (nombre):
Indicadores del desarrollo mundial
Fuente (organización):
World Trade Organization.
Categorías:
Private Sector, Trade
Se ha actualizado:
23 abr 2017 año
Los indicadores de los cambios de valor en los últimos años
Mínimo:
192.22 millones
1 ene 1963 año
Máximo:
79.298 bn
1 ene 2009 año
A la fecha de observación
Valor
Cambio absoluto
El cambio con respecto al valor anterior
1 ene 1961 año
394.162 millones
+394.162 millones
0.0%
1 ene 1962 año
367.425 millones
-26.737 millones
-6.78%
1 ene 1963 año
192.22 millones
-175.205 millones
-47.68%
1 ene 1964 año
758.751 millones
+566.531 millones
294.73%
1 ene 1965 año
727.153 millones
-31.598 millones
-4.16%
1 ene 1966 año
637.221 millones
-89.932 millones
-12.37%
1 ene 1967 año
621.22 millones
-16.001 millones
-2.51%
1 ene 1968 año
723.305 millones
+102.085 millones
16.43%
1 ene 1969 año
830.049 millones
+106.744 millones
14.76%
1 ene 1970 año
933.957 millones
+103.908 millones
12.52%
1 ene 1971 año
1.009 bn
+74.743 millones
8.0%
1 ene 1972 año
856.566 millones
-152.134 millones
-15.08%
1 ene 1973 año
1.304 bn
+447.614 millones
52.26%
1 ene 1974 año
1.887 bn
+583.27 millones
44.72%
1 ene 1975 año
4.687 bn
+2.799 bn
148.31%
1 ene 1976 año
4.7 bn
+13.48 millones
0.29%
1 ene 1977 año
5.259 bn
+558.67 millones
11.89%
1 ene 1978 año
5.944 bn
+685.53 millones
13.04%
1 ene 1979 año
6.326 bn
+381.53 millones
6.42%
1 ene 1980 año
9.551 bn
+3.225 bn
50.98%
1 ene 1981 año
13.871 bn
+4.32 bn
45.23%
1 ene 1982 año
14.396 bn
+525.0 millones
3.78%
1 ene 1983 año
13.17 bn
-1.226 bn
-8.52%
1 ene 1984 año
12.583 bn
-587.0 millones
-4.46%
1 ene 1985 año
12.795 bn
+212.0 millones
1.68%
1 ene 1986 año
12.841 bn
+46.0 millones
0.36%
1 ene 1987 año
7.832 bn
-5.009 bn
-39.01%
1 ene 1988 año
8.225 bn
+393.0 millones
5.02%
1 ene 1989 año
7.81 bn
-415.0 millones
-5.05%
1 ene 1990 año
9.57 bn
+1.76 bn
22.54%
1 ene 1991 año
12.93 bn
+3.36 bn
35.11%
1 ene 1992 año
12.57 bn
-360.0 millones
-2.78%
1 ene 1993 año
11.13 bn
-1.44 bn
-11.46%
1 ene 1994 año
10.23 bn
-900.0 millones
-8.09%
1 ene 1995 año
8.88 bn
-1.35 bn
-13.2%
1 ene 1996 año
10.258 bn
+1.378 bn
15.52%
1 ene 1997 año
13.22 bn
+2.962 bn
28.88%
1 ene 1998 año
13.894 bn
+674.0 millones
5.1%
1 ene 1999 año
10.209 bn
-3.685 bn
-26.52%
1 ene 2000 año
12.525 bn
+2.316 bn
22.69%
1 ene 2001 año
22.031 bn
+9.506 bn
75.9%
1 ene 2002 año
19.133 bn
-2.898 bn
-13.15%
1 ene 2003 año
18.799 bn
-334.0 millones
-1.75%
1 ene 2004 año
23.163 bn
+4.364 bn
23.21%
1 ene 2005 año
31.304 bn
+8.141 bn
35.15%
1 ene 2006 año
46.002 bn
+14.698 bn
46.95%
1 ene 2007 año
54.613 bn
+8.611 bn
18.72%
1 ene 2008 año
60.163 bn
+5.55 bn
10.16%
1 ene 2009 año
79.298 bn
+19.135 bn
31.8%
1 ene 2010 año
45.174 bn
-34.124 bn
-43.03%
1 ene 2011 año
57.053 bn
+11.879 bn
26.3%
1 ene 2012 año
73.489 bn
+16.436 bn
28.81%
1 ene 2013 año
71.866 bn
-1.623 bn
-2.21%
1 ene 2014 año
64.974 bn
-6.892 bn
-9.59%
1 ene 2015 año
62.886 bn
-2.088 bn
-3.21%
1 ene 2016 año
37.787 bn
-25.099 bn
-39.91%
Ranking de los países por los datos estadísticos actuales


Comentarios: