29
/es/
es
AIzaSyAYiBZKx7MnpbEhh9jyipgxe19OcubqV5w
April 1, 2024
26712
Early-demographic dividend
EAR
false
2
1
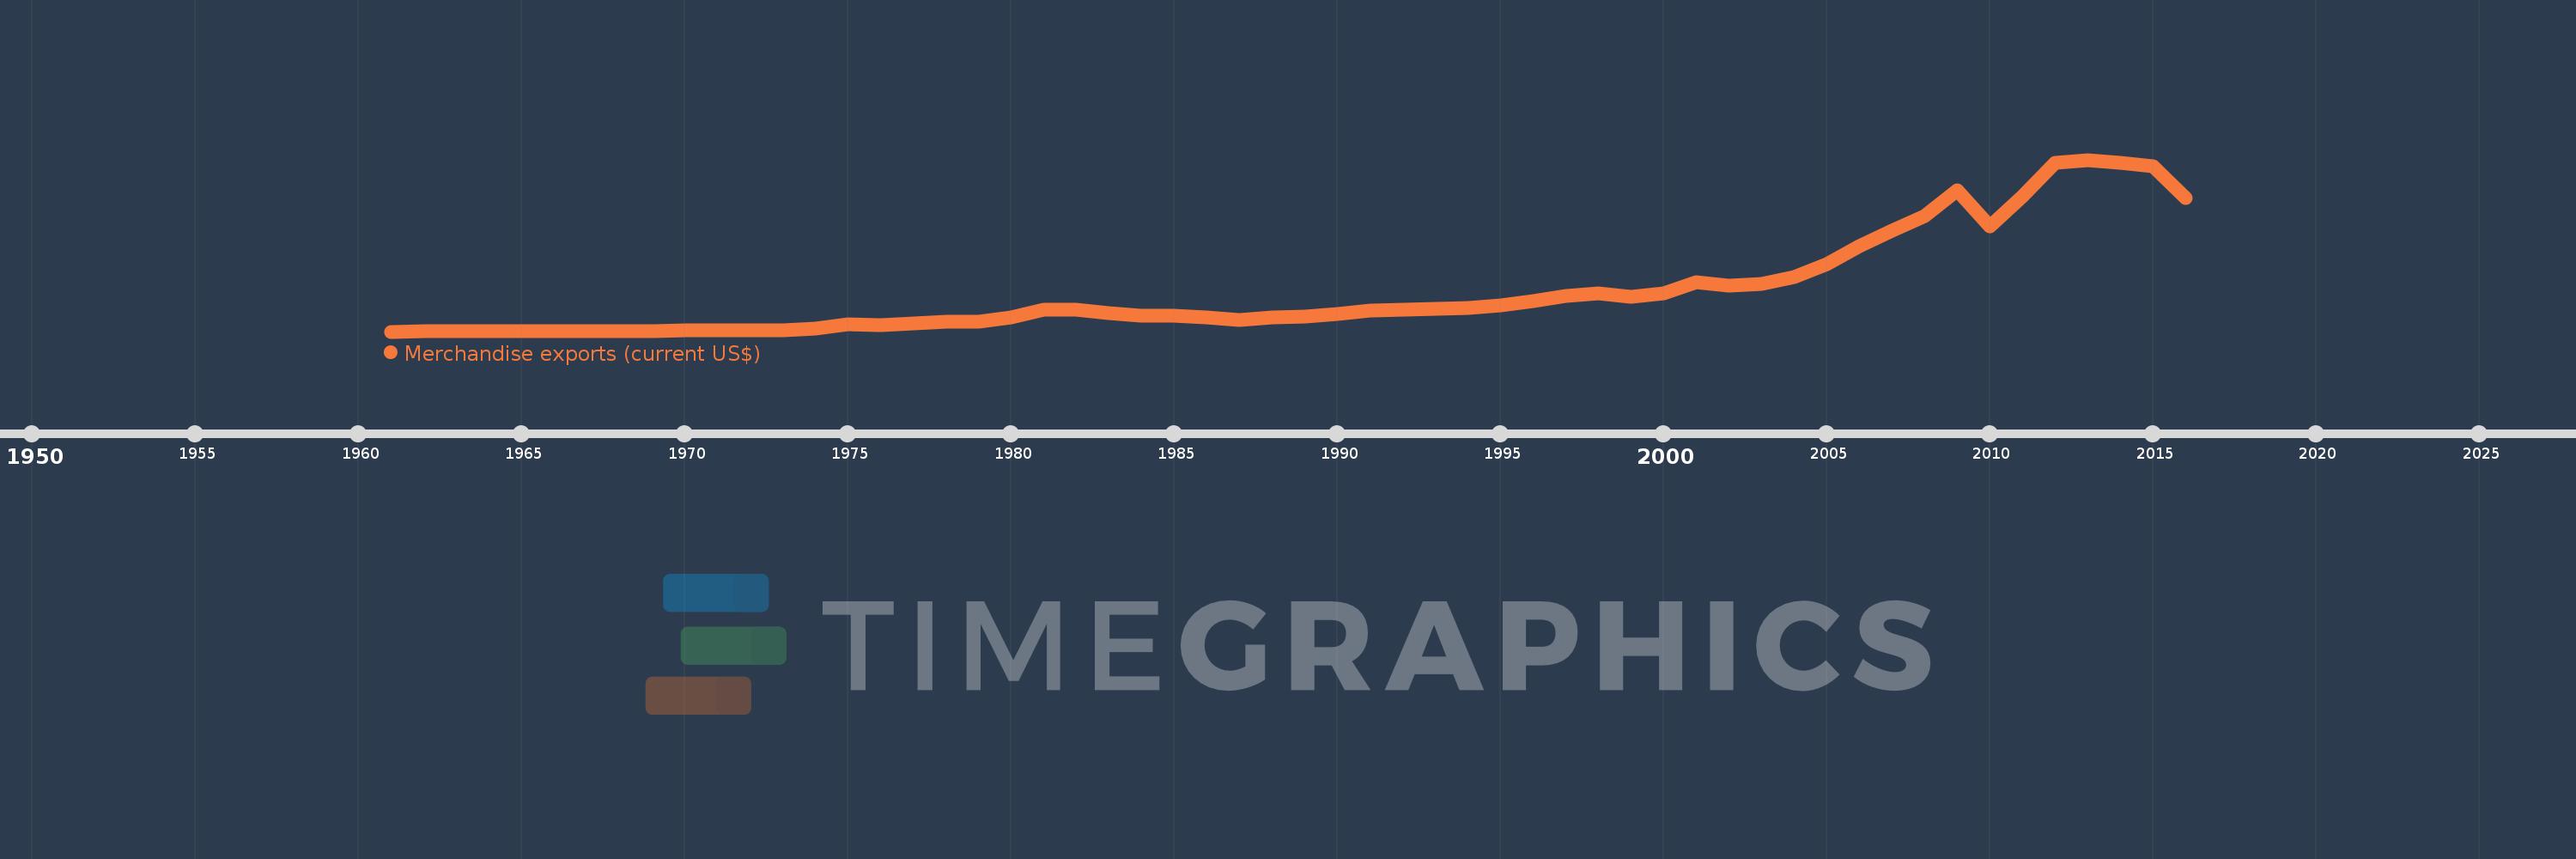
Merchandise exports (current US$)
2016,2015,2014,2013,2012,2011,2010,2009,2008,2007,2006,2005,2004,2003,2002,2001,2000,1999,1998,1997,1996,1995,1994,1993,1992,1991,1990,1989,1988,1987,1986,1985,1984,1983,1982,1981,1980,1979,1978,1977,1976,1975,1974,1973,1972,1971,1970,1969,1968,1967,1966,1965,1964,1963,1962,1961
Estas estadísticas en otros países:
AfghanistanAlbaniaAlgeriaAmerican SamoaAngolaAntigua and BarbudaArab WorldArgentinaArmeniaArubaAustraliaAustriaAzerbaijanBahamas, TheBahrainBangladeshBarbadosBelarusBelgiumBelizeBeninBermudaBhutanBoliviaBosnia and HerzegovinaBotswanaBrazilBrunei DarussalamBulgariaBurkina FasoBurundiCabo VerdeCambodiaCameroonCanadaCaribbean small statesCentral African RepublicCentral Europe and the BalticsChadChileChinaColombiaComorosCongo, Dem. Rep.Congo, Rep.Costa RicaCote d'IvoireCroatiaCubaCuracaoCyprusCzech RepublicDenmarkDjiboutiDominicaDominican RepublicEarly-demographic dividendEast Asia & PacificEast Asia & Pacific (excluding high income)East Asia & Pacific (IDA & IBRD countries)EcuadorEgypt, Arab Rep.El SalvadorEquatorial GuineaEritreaEstoniaEthiopiaEuro areaEurope & Central AsiaEurope & Central Asia (excluding high income)Europe & Central Asia (IDA & IBRD countries)European UnionFaroe IslandsFijiFinlandFragile and conflict affected situationsFranceFrench PolynesiaGabonGambia, TheGeorgiaGermanyGhanaGreeceGreenlandGrenadaGuamGuatemalaGuineaGuinea-BissauGuyanaHaitiHeavily indebted poor countries (HIPC)High incomeHondurasHong Kong SAR, ChinaHungaryIBRD onlyIcelandIDA & IBRD totalIDA blendIDA onlyIDA totalIndiaIndonesiaIran, Islamic Rep.IraqIrelandIsraelItalyJamaicaJapanJordanKazakhstanKenyaKiribatiKorea, Dem. People’s Rep.Korea, Rep.KuwaitKyrgyz RepublicLao PDRLate-demographic dividendLatin America & Caribbean Latin America & Caribbean (excluding high income)Latin America & the Caribbean (IDA & IBRD countries)LatviaLeast developed countries: UN classificationLebanonLesothoLiberiaLibyaLithuaniaLow & middle incomeLow incomeLower middle incomeLuxembourgMacao SAR, ChinaMacedonia, FYRMadagascarMalawiMalaysiaMaldivesMaliMaltaMarshall IslandsMauritaniaMauritiusMexicoMicronesia, Fed. Sts.Middle East & North AfricaMiddle East & North Africa (excluding high income)Middle East & North Africa (IDA & IBRD countries)Middle incomeMoldovaMongoliaMontenegroMoroccoMozambiqueMyanmarNamibiaNepalNetherlandsNew CaledoniaNew ZealandNicaraguaNigerNigeriaNorth AmericaNorthern Mariana IslandsNorwayOECD membersOmanOther small statesPacific island small statesPakistanPalauPanamaPapua New GuineaParaguayPeruPhilippinesPolandPortugalPost-demographic dividendPre-demographic dividendQatarRomaniaRussian FederationRwandaSamoaSao Tome and PrincipeSaudi ArabiaSenegalSerbiaSeychellesSierra LeoneSingaporeSint Maarten (Dutch part)Slovak RepublicSloveniaSmall statesSolomon IslandsSouth AfricaSouth AsiaSouth Asia (IDA & IBRD)SpainSri LankaSt. Kitts and NevisSt. LuciaSt. Martin (French part)St. Vincent and the GrenadinesSub-Saharan Africa Sub-Saharan Africa (excluding high income)Sub-Saharan Africa (IDA & IBRD countries)SudanSurinameSwazilandSwedenSwitzerlandSyrian Arab RepublicTajikistanTanzaniaThailandTimor-LesteTogoTongaTrinidad and TobagoTunisiaTurkeyTurkmenistanTuvaluUgandaUkraineUnited Arab EmiratesUnited KingdomUnited StatesUpper middle incomeUruguayUzbekistanVanuatuVenezuela, RBVietnamWorldYemen, Rep.ZambiaZimbabwe línea de tiempo (timeline):
En esta escala de tiempo se presenta un gráfico de 1961 y 2016 de Early-demographic dividend. Los datos de 1960 están ausentes. El número de observaciones reales por fecha: 56.
Fuente (nombre):
Indicadores del desarrollo mundial
Fuente (organización):
World Trade Organization.
Categorías:
Private Sector, Trade
Se ha actualizado:
23 abr 2017 año
Los indicadores de los cambios de valor en los últimos años
Mínimo:
15.628 bn
1 ene 1961 año
Máximo:
2.396 billones
1 ene 2013 año
A la fecha de observación
Valor
Cambio absoluto
El cambio con respecto al valor anterior
1 ene 1961 año
15.628 bn
+15.628 bn
0.0%
1 ene 1962 año
15.912 bn
+283.658 millones
1.82%
1 ene 1963 año
16.601 bn
+689.8 millones
4.34%
1 ene 1964 año
18.75 bn
+2.149 bn
12.94%
1 ene 1965 año
20.586 bn
+1.836 bn
9.79%
1 ene 1966 año
21.545 bn
+959.544 millones
4.66%
1 ene 1967 año
22.773 bn
+1.228 bn
5.7%
1 ene 1968 año
24.399 bn
+1.626 bn
7.14%
1 ene 1969 año
25.538 bn
+1.139 bn
4.67%
1 ene 1970 año
27.914 bn
+2.376 bn
9.3%
1 ene 1971 año
30.468 bn
+2.554 bn
9.15%
1 ene 1972 año
34.366 bn
+3.898 bn
12.79%
1 ene 1973 año
38.154 bn
+3.789 bn
11.02%
1 ene 1974 año
54.97 bn
+16.815 bn
44.07%
1 ene 1975 año
119.182 bn
+64.213 bn
116.81%
1 ene 1976 año
107.478 bn
-11.704 bn
-9.82%
1 ene 1977 año
127.829 bn
+20.351 bn
18.94%
1 ene 1978 año
148.133 bn
+20.304 bn
15.88%
1 ene 1979 año
152.316 bn
+4.183 bn
2.82%
1 ene 1980 año
214.705 bn
+62.389 bn
40.96%
1 ene 1981 año
314.052 bn
+99.347 bn
46.27%
1 ene 1982 año
323.143 bn
+9.091 bn
2.89%
1 ene 1983 año
276.786 bn
-46.356 bn
-14.35%
1 ene 1984 año
240.822 bn
-35.965 bn
-12.99%
1 ene 1985 año
234.962 bn
-5.859 bn
-2.43%
1 ene 1986 año
214.945 bn
-20.018 bn
-8.52%
1 ene 1987 año
177.089 bn
-37.856 bn
-17.61%
1 ene 1988 año
207.259 bn
+30.17 bn
17.04%
1 ene 1989 año
224.038 bn
+16.779 bn
8.1%
1 ene 1990 año
254.424 bn
+30.386 bn
13.56%
1 ene 1991 año
310.723 bn
+56.299 bn
22.13%
1 ene 1992 año
315.099 bn
+4.376 bn
1.41%
1 ene 1993 año
331.61 bn
+16.511 bn
5.24%
1 ene 1994 año
338.143 bn
+6.533 bn
1.97%
1 ene 1995 año
373.899 bn
+35.757 bn
10.57%
1 ene 1996 año
441.466 bn
+67.567 bn
18.07%
1 ene 1997 año
505.373 bn
+63.908 bn
14.48%
1 ene 1998 año
542.244 bn
+36.87 bn
7.3%
1 ene 1999 año
494.255 bn
-47.989 bn
-8.85%
1 ene 2000 año
550.963 bn
+56.708 bn
11.47%
1 ene 2001 año
698.363 bn
+147.4 bn
26.75%
1 ene 2002 año
651.517 bn
-46.845 bn
-6.71%
1 ene 2003 año
678.208 bn
+26.69 bn
4.1%
1 ene 2004 año
776.382 bn
+98.174 bn
14.48%
1 ene 2005 año
954.251 bn
+177.869 bn
22.91%
1 ene 2006 año
1.194 billones
+239.982 bn
25.15%
1 ene 2007 año
1.418 billones
+224.078 bn
18.76%
1 ene 2008 año
1.614 billones
+195.93 bn
13.81%
1 ene 2009 año
1.97 billones
+355.996 bn
22.05%
1 ene 2010 año
1.47 billones
-500.703 bn
-25.41%
1 ene 2011 año
1.887 billones
+416.999 bn
28.38%
1 ene 2012 año
2.349 billones
+462.41 bn
24.51%
1 ene 2013 año
2.396 billones
+46.594 bn
1.98%
1 ene 2014 año
2.356 billones
-39.308 bn
-1.64%
1 ene 2015 año
2.308 billones
-48.472 bn
-2.06%
1 ene 2016 año
1.861 billones
-446.569 bn
-19.35%
Ranking de los países por los datos estadísticos actuales


Comentarios: