30
/es/
AIzaSyAYiBZKx7MnpbEhh9jyipgxe19OcubqV5w
April 1, 2024
67800
Angola
AGO
true
2
1
Gross domestic savings (current US$)
2016,2015,2014,2013,2012,2011,2010,2009,2008,2007,2006,2005,2004,2003,2002,2001,2000,1999,1998,1997,1995,1991,1990,1989,1988,1987,1986
Download
Estadísticas Globales de la Biblioteca →Angola →

Gross domestic savings (current US$)

Estas estadísticas en otros países:

AfghanistanAlbaniaAlgeriaAngolaAntigua and BarbudaArab WorldArgentinaArmeniaArubaAustraliaAustriaAzerbaijanBahamas, TheBahrainBangladeshBarbadosBelarusBelgiumBelizeBeninBermudaBhutanBoliviaBosnia and HerzegovinaBotswanaBrazilBrunei DarussalamBulgariaBurkina FasoBurundiCabo VerdeCambodiaCameroonCanadaCaribbean small statesCentral African RepublicCentral Europe and the BalticsChadChileChinaColombiaComorosCongo, Dem. Rep.Congo, Rep.Costa RicaCote d'IvoireCroatiaCubaCyprusCzech RepublicDenmarkDjiboutiDominicaDominican RepublicEarly-demographic dividendEast Asia & PacificEast Asia & Pacific (excluding high income)East Asia & Pacific (IDA & IBRD countries)EcuadorEgypt, Arab Rep.El SalvadorEquatorial GuineaEritreaEstoniaEthiopiaEuro areaEurope & Central AsiaEurope & Central Asia (excluding high income)Europe & Central Asia (IDA & IBRD countries)European UnionFaroe IslandsFijiFinlandFragile and conflict affected situationsFranceGabonGambia, TheGeorgiaGermanyGhanaGreeceGrenadaGuatemalaGuineaGuinea-BissauGuyanaHaitiHeavily indebted poor countries (HIPC)High incomeHondurasHong Kong SAR, ChinaHungaryIBRD onlyIcelandIDA & IBRD totalIDA blendIDA onlyIDA totalIndiaIndonesiaIran, Islamic Rep.IraqIrelandIsraelItalyJamaicaJapanJordanKazakhstanKenyaKiribatiKorea, Rep.KosovoKuwaitKyrgyz RepublicLao PDRLate-demographic dividendLatin America & Caribbean Latin America & Caribbean (excluding high income)Latin America & the Caribbean (IDA & IBRD countries)LatviaLeast developed countries: UN classificationLebanonLesothoLiberiaLibyaLithuaniaLow & middle incomeLow incomeLower middle incomeLuxembourgMacao SAR, ChinaMacedonia, FYRMadagascarMalawiMalaysiaMaldivesMaliMaltaMauritaniaMauritiusMexicoMicronesia, Fed. Sts.Middle East & North AfricaMiddle East & North Africa (excluding high income)Middle East & North Africa (IDA & IBRD countries)Middle incomeMoldovaMongoliaMontenegroMoroccoMozambiqueNamibiaNepalNetherlandsNew CaledoniaNew ZealandNicaraguaNigerNigeriaNorth AmericaNorwayOECD membersOmanOther small statesPakistanPanamaPapua New GuineaParaguayPeruPhilippinesPolandPortugalPost-demographic dividendPre-demographic dividendPuerto RicoQatarRomaniaRussian FederationRwandaSaudi ArabiaSenegalSerbiaSeychellesSierra LeoneSingaporeSlovak RepublicSloveniaSmall statesSolomon IslandsSouth AfricaSouth AsiaSouth Asia (IDA & IBRD)South SudanSpainSri LankaSt. Kitts and NevisSt. LuciaSt. Vincent and the GrenadinesSub-Saharan Africa Sub-Saharan Africa (excluding high income)Sub-Saharan Africa (IDA & IBRD countries)SudanSurinameSwazilandSwedenSwitzerlandSyrian Arab RepublicTajikistanTanzaniaThailandTimor-LesteTogoTongaTrinidad and TobagoTunisiaTurkeyTurkmenistanUgandaUkraineUnited Arab EmiratesUnited KingdomUnited StatesUpper middle incomeUruguayUzbekistanVanuatuVenezuela, RBVietnamWest Bank and GazaWorldYemen, Rep.ZambiaZimbabwe

línea de tiempo (timeline):

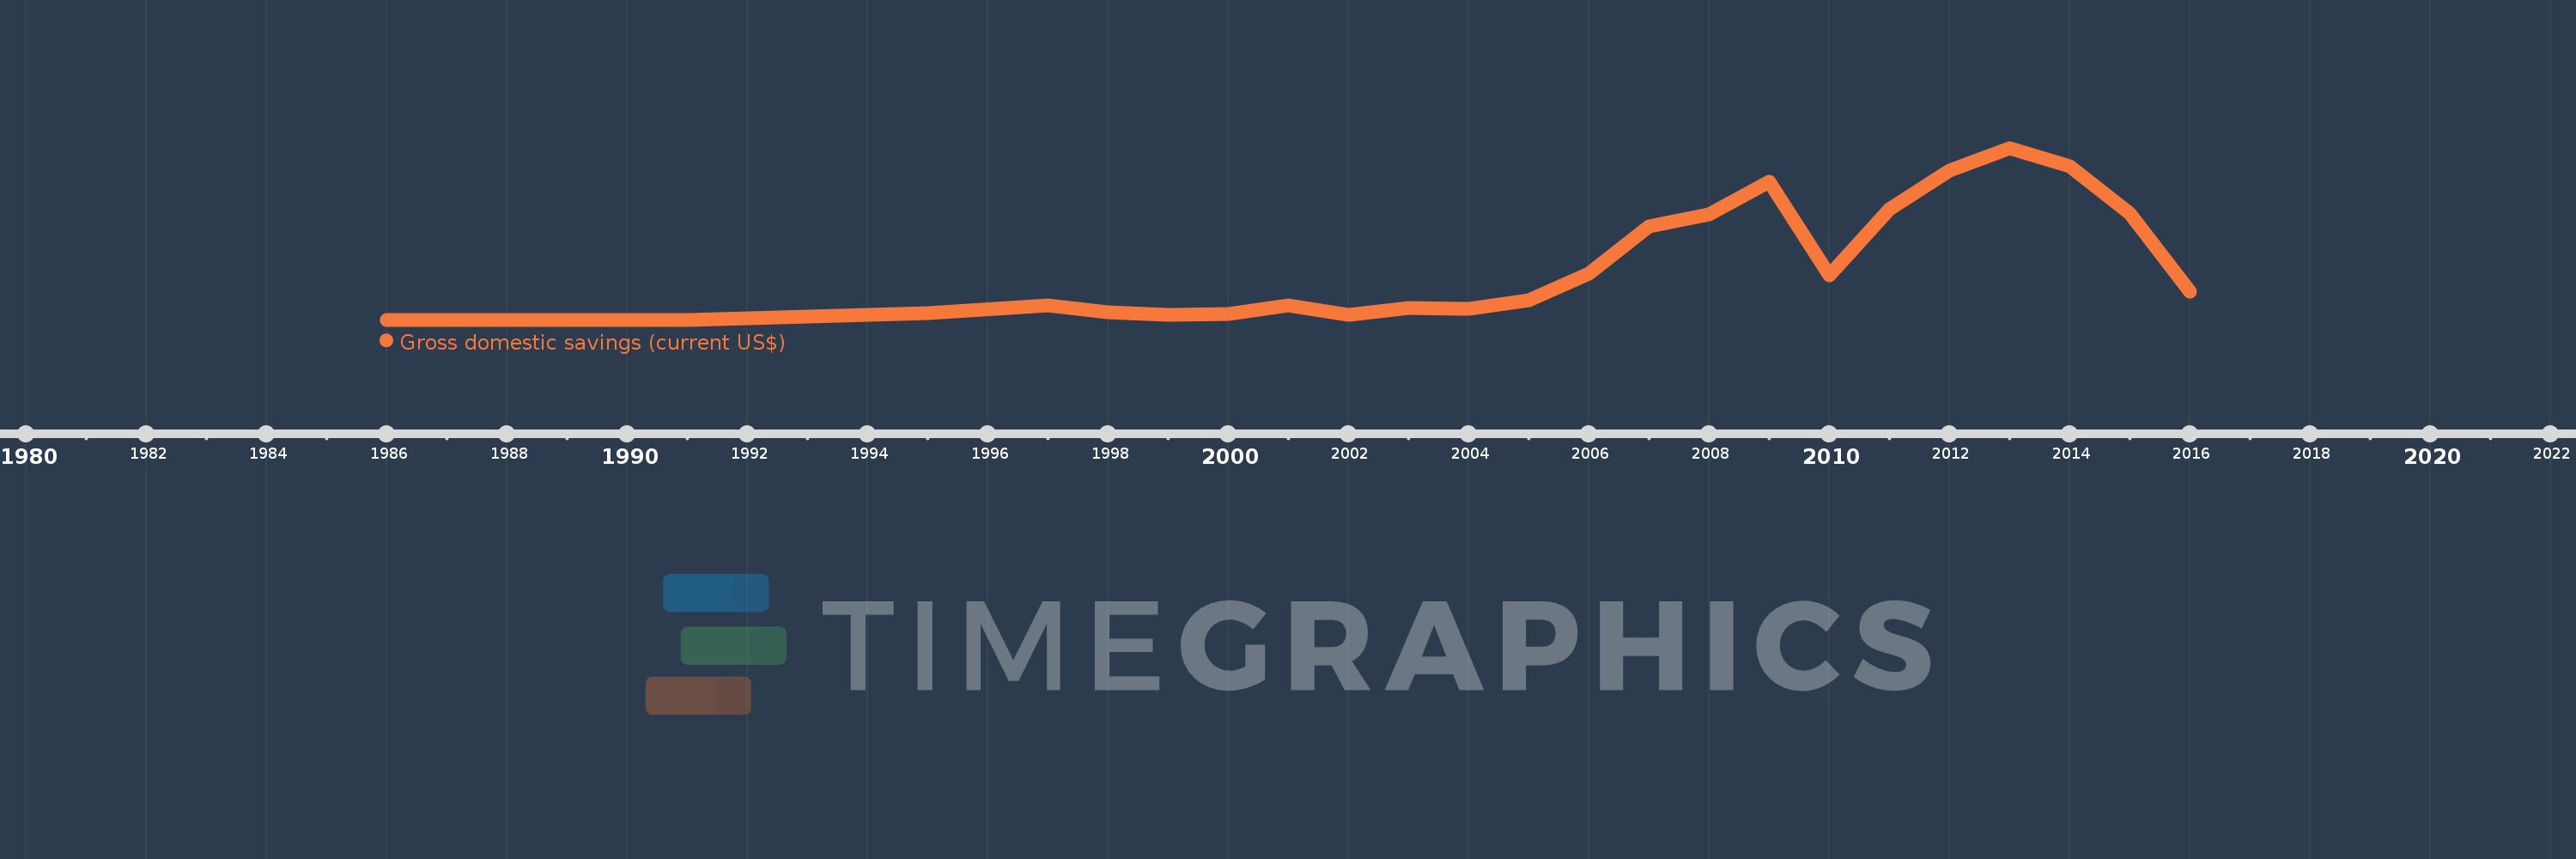
En esta escala de tiempo se presenta un gráfico de 1986 y 2016 de Angola. Los datos de 1985 están ausentes. El número de observaciones reales por fecha: 27.

Fuente (nombre):

Indicadores del desarrollo mundial

Fuente (organización):

World Bank national accounts data, and OECD National Accounts data files.

Categorías:

Economy & Growth

Se ha actualizado:

23 abr 2017 año

Los indicadores de los cambios de valor en los últimos años

En promedio:
11.638 bn
Mínimo:
0.0
1 ene 1986 año
Máximo:
43.281 bn
1 ene 2013 año
A la fecha de observación
Valor
Cambio absoluto
El cambio con respecto al valor anterior
1 ene 1986 año
0.0
0.0
0.0%
1 ene 1987 año
0.0
0.0
%
1 ene 1988 año
0.0
0.0
%
1 ene 1989 año
0.0
0.0
%
1 ene 1990 año
0.0
0.0
%
1 ene 1991 año
0.0
0.0
%
1 ene 1995 año
1.619 bn
+1.619 bn
%
1 ene 1997 año
3.625 bn
+2.006 bn
123.89%
1 ene 1998 año
1.902 bn
-1.722 bn
-47.51%
1 ene 1999 año
1.24 bn
-662.405 millones
-34.82%
1 ene 2000 año
1.384 bn
+144.258 millones
11.63%
1 ene 2001 año
3.611 bn
+2.227 bn
160.86%
1 ene 2002 año
1.242 bn
-2.37 bn
-65.62%
1 ene 2003 año
2.93 bn
+1.688 bn
135.98%
1 ene 2004 año
2.73 bn
-199.93 millones
-6.82%
1 ene 2005 año
4.964 bn
+2.234 bn
81.83%
1 ene 2006 año
11.621 bn
+6.657 bn
134.12%
1 ene 2007 año
23.477 bn
+11.856 bn
102.03%
1 ene 2008 año
26.566 bn
+3.089 bn
13.16%
1 ene 2009 año
34.775 bn
+8.209 bn
30.9%
1 ene 2010 año
11.119 bn
-23.656 bn
-68.03%
1 ene 2011 año
27.933 bn
+16.815 bn
151.23%
1 ene 2012 año
37.581 bn
+9.648 bn
34.54%
1 ene 2013 año
43.281 bn
+5.7 bn
15.17%
1 ene 2014 año
38.732 bn
-4.549 bn
-10.51%
1 ene 2015 año
26.785 bn
-11.947 bn
-30.85%
1 ene 2016 año
7.112 bn
-19.673 bn
-73.45%

Ranking de los países por los datos estadísticos actuales