29
/es/
es
AIzaSyAYiBZKx7MnpbEhh9jyipgxe19OcubqV5w
April 1, 2024
33468
European Union
EUU
false
2
1
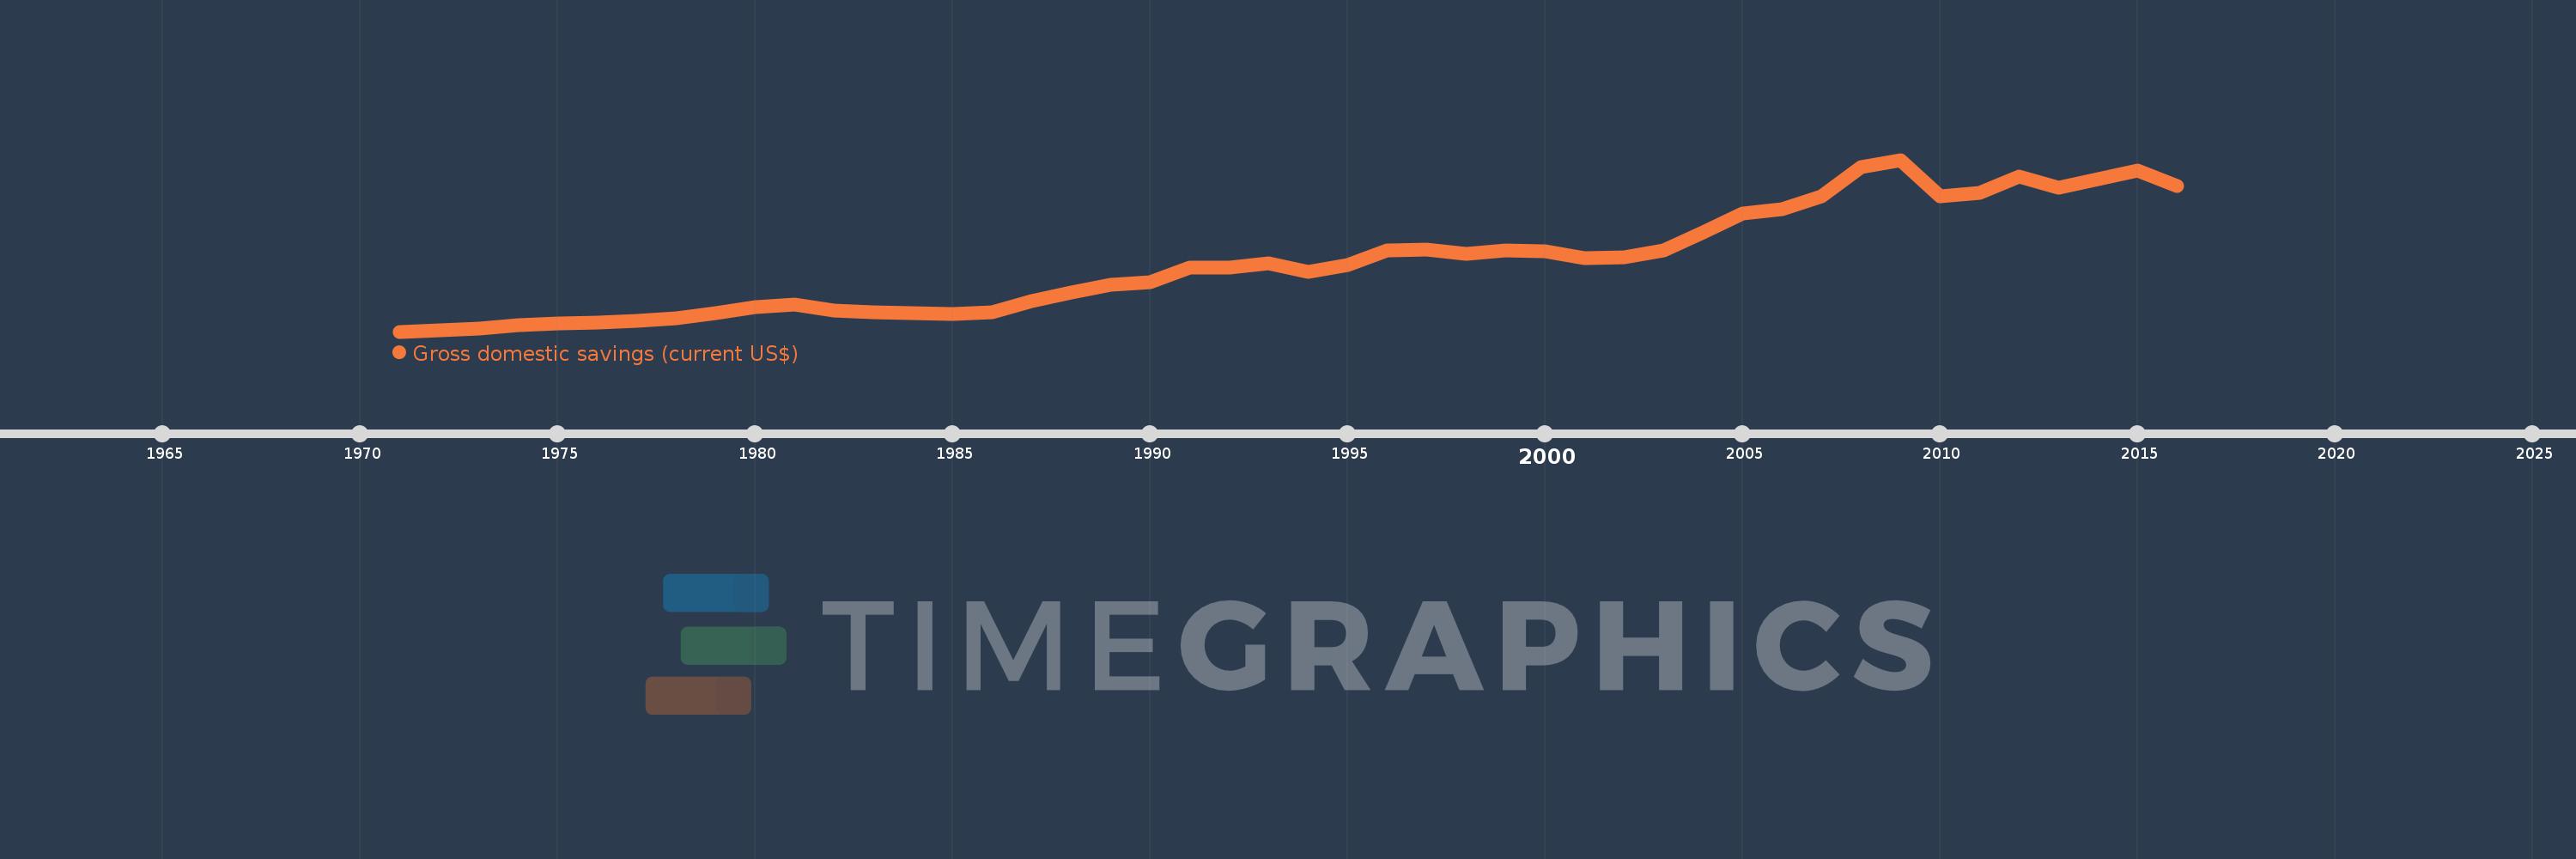
Gross domestic savings (current US$)
2016,2015,2014,2013,2012,2011,2010,2009,2008,2007,2006,2005,2004,2003,2002,2001,2000,1999,1998,1997,1996,1995,1994,1993,1992,1991,1990,1989,1988,1987,1986,1985,1984,1983,1982,1981,1980,1979,1978,1977,1976,1975,1974,1973,1972,1971
Estas estadísticas en otros países:
AfghanistanAlbaniaAlgeriaAngolaAntigua and BarbudaArab WorldArgentinaArmeniaArubaAustraliaAustriaAzerbaijanBahamas, TheBahrainBangladeshBarbadosBelarusBelgiumBelizeBeninBermudaBhutanBoliviaBosnia and HerzegovinaBotswanaBrazilBrunei DarussalamBulgariaBurkina FasoBurundiCabo VerdeCambodiaCameroonCanadaCaribbean small statesCentral African RepublicCentral Europe and the BalticsChadChileChinaColombiaComorosCongo, Dem. Rep.Congo, Rep.Costa RicaCote d'IvoireCroatiaCubaCyprusCzech RepublicDenmarkDjiboutiDominicaDominican RepublicEarly-demographic dividendEast Asia & PacificEast Asia & Pacific (excluding high income)East Asia & Pacific (IDA & IBRD countries)EcuadorEgypt, Arab Rep.El SalvadorEquatorial GuineaEritreaEstoniaEthiopiaEuro areaEurope & Central AsiaEurope & Central Asia (excluding high income)Europe & Central Asia (IDA & IBRD countries)European UnionFaroe IslandsFijiFinlandFragile and conflict affected situationsFranceGabonGambia, TheGeorgiaGermanyGhanaGreeceGrenadaGuatemalaGuineaGuinea-BissauGuyanaHaitiHeavily indebted poor countries (HIPC)High incomeHondurasHong Kong SAR, ChinaHungaryIBRD onlyIcelandIDA & IBRD totalIDA blendIDA onlyIDA totalIndiaIndonesiaIran, Islamic Rep.IraqIrelandIsraelItalyJamaicaJapanJordanKazakhstanKenyaKiribatiKorea, Rep.KosovoKuwaitKyrgyz RepublicLao PDRLate-demographic dividendLatin America & Caribbean Latin America & Caribbean (excluding high income)Latin America & the Caribbean (IDA & IBRD countries)LatviaLeast developed countries: UN classificationLebanonLesothoLiberiaLibyaLithuaniaLow & middle incomeLow incomeLower middle incomeLuxembourgMacao SAR, ChinaMacedonia, FYRMadagascarMalawiMalaysiaMaldivesMaliMaltaMauritaniaMauritiusMexicoMicronesia, Fed. Sts.Middle East & North AfricaMiddle East & North Africa (excluding high income)Middle East & North Africa (IDA & IBRD countries)Middle incomeMoldovaMongoliaMontenegroMoroccoMozambiqueNamibiaNepalNetherlandsNew CaledoniaNew ZealandNicaraguaNigerNigeriaNorth AmericaNorwayOECD membersOmanOther small statesPakistanPanamaPapua New GuineaParaguayPeruPhilippinesPolandPortugalPost-demographic dividendPre-demographic dividendPuerto RicoQatarRomaniaRussian FederationRwandaSaudi ArabiaSenegalSerbiaSeychellesSierra LeoneSingaporeSlovak RepublicSloveniaSmall statesSolomon IslandsSouth AfricaSouth AsiaSouth Asia (IDA & IBRD)South SudanSpainSri LankaSt. Kitts and NevisSt. LuciaSt. Vincent and the GrenadinesSub-Saharan Africa Sub-Saharan Africa (excluding high income)Sub-Saharan Africa (IDA & IBRD countries)SudanSurinameSwazilandSwedenSwitzerlandSyrian Arab RepublicTajikistanTanzaniaThailandTimor-LesteTogoTongaTrinidad and TobagoTunisiaTurkeyTurkmenistanUgandaUkraineUnited Arab EmiratesUnited KingdomUnited StatesUpper middle incomeUruguayUzbekistanVanuatuVenezuela, RBVietnamWest Bank and GazaWorldYemen, Rep.ZambiaZimbabwe línea de tiempo (timeline):
En esta escala de tiempo se presenta un gráfico de 1971 y 2016 de European Union. Los datos de 1970 están ausentes. El número de observaciones reales por fecha: 46.
Fuente (nombre):
Indicadores del desarrollo mundial
Fuente (organización):
World Bank national accounts data, and OECD National Accounts data files.
Categorías:
Economy & Growth
Se ha actualizado:
23 abr 2017 año
Los indicadores de los cambios de valor en los últimos años
En promedio:
1.925 billones
Mínimo:
243.714 bn
1 ene 1971 año
Máximo:
4.421 billones
1 ene 2009 año
A la fecha de observación
Valor
Cambio absoluto
El cambio con respecto al valor anterior
1 ene 1971 año
243.714 bn
+243.714 bn
0.0%
1 ene 1972 año
268.641 bn
+24.926 bn
10.23%
1 ene 1973 año
315.734 bn
+47.094 bn
17.53%
1 ene 1974 año
408.456 bn
+92.721 bn
29.37%
1 ene 1975 año
440.547 bn
+32.091 bn
7.86%
1 ene 1976 año
472.704 bn
+32.157 bn
7.3%
1 ene 1977 año
497.946 bn
+25.242 bn
5.34%
1 ene 1978 año
558.135 bn
+60.189 bn
12.09%
1 ene 1979 año
687.383 bn
+129.248 bn
23.16%
1 ene 1980 año
833.068 bn
+145.685 bn
21.19%
1 ene 1981 año
909.026 bn
+75.958 bn
9.12%
1 ene 1982 año
748.812 bn
-160.214 bn
-17.62%
1 ene 1983 año
712.566 bn
-36.246 bn
-4.84%
1 ene 1984 año
694.785 bn
-17.781 bn
-2.5%
1 ene 1985 año
681.912 bn
-12.873 bn
-1.85%
1 ene 1986 año
706.48 bn
+24.568 bn
3.6%
1 ene 1987 año
987.609 bn
+281.129 bn
39.79%
1 ene 1988 año
1.204 billones
+216.272 bn
21.9%
1 ene 1989 año
1.39 billones
+186.394 bn
15.48%
1 ene 1990 año
1.448 billones
+57.521 bn
4.14%
1 ene 1991 año
1.795 billones
+347.629 bn
24.01%
1 ene 1992 año
1.807 billones
+12.009 bn
0.67%
1 ene 1993 año
1.9 billones
+92.679 bn
5.13%
1 ene 1994 año
1.696 billones
-204.55 bn
-10.77%
1 ene 1995 año
1.855 billones
+159.853 bn
9.43%
1 ene 1996 año
2.218 billones
+362.532 bn
19.54%
1 ene 1997 año
2.237 billones
+19.308 bn
0.87%
1 ene 1998 año
2.132 billones
-105.16 bn
-4.7%
1 ene 1999 año
2.226 billones
+93.855 bn
4.4%
1 ene 2000 año
2.191 billones
-34.813 bn
-1.56%
1 ene 2001 año
2.039 billones
-152.026 bn
-6.94%
1 ene 2002 año
2.052 billones
+12.727 bn
0.62%
1 ene 2003 año
2.218 billones
+166.498 bn
8.11%
1 ene 2004 año
2.662 billones
+443.925 bn
20.01%
1 ene 2005 año
3.107 billones
+444.259 bn
16.69%
1 ene 2006 año
3.223 billones
+116.764 bn
3.76%
1 ene 2007 año
3.532 billones
+308.386 bn
9.57%
1 ene 2008 año
4.24 billones
+708.326 bn
20.06%
1 ene 2009 año
4.421 billones
+181.344 bn
4.28%
1 ene 2010 año
3.542 billones
-878.863 bn
-19.88%
1 ene 2011 año
3.607 billones
+64.683 bn
1.83%
1 ene 2012 año
4.023 billones
+415.476 bn
11.52%
1 ene 2013 año
3.734 billones
-288.361 bn
-7.17%
1 ene 2014 año
3.945 billones
+210.883 bn
5.65%
1 ene 2015 año
4.167 billones
+221.408 bn
5.61%
1 ene 2016 año
3.778 billones
-389.022 bn
-9.34%
Ranking de los países por los datos estadísticos actuales


Comentarios: