29
/es/
es
AIzaSyAYiBZKx7MnpbEhh9jyipgxe19OcubqV5w
April 1, 2024
281026
Venezuela, RB
VEN
true
2
1
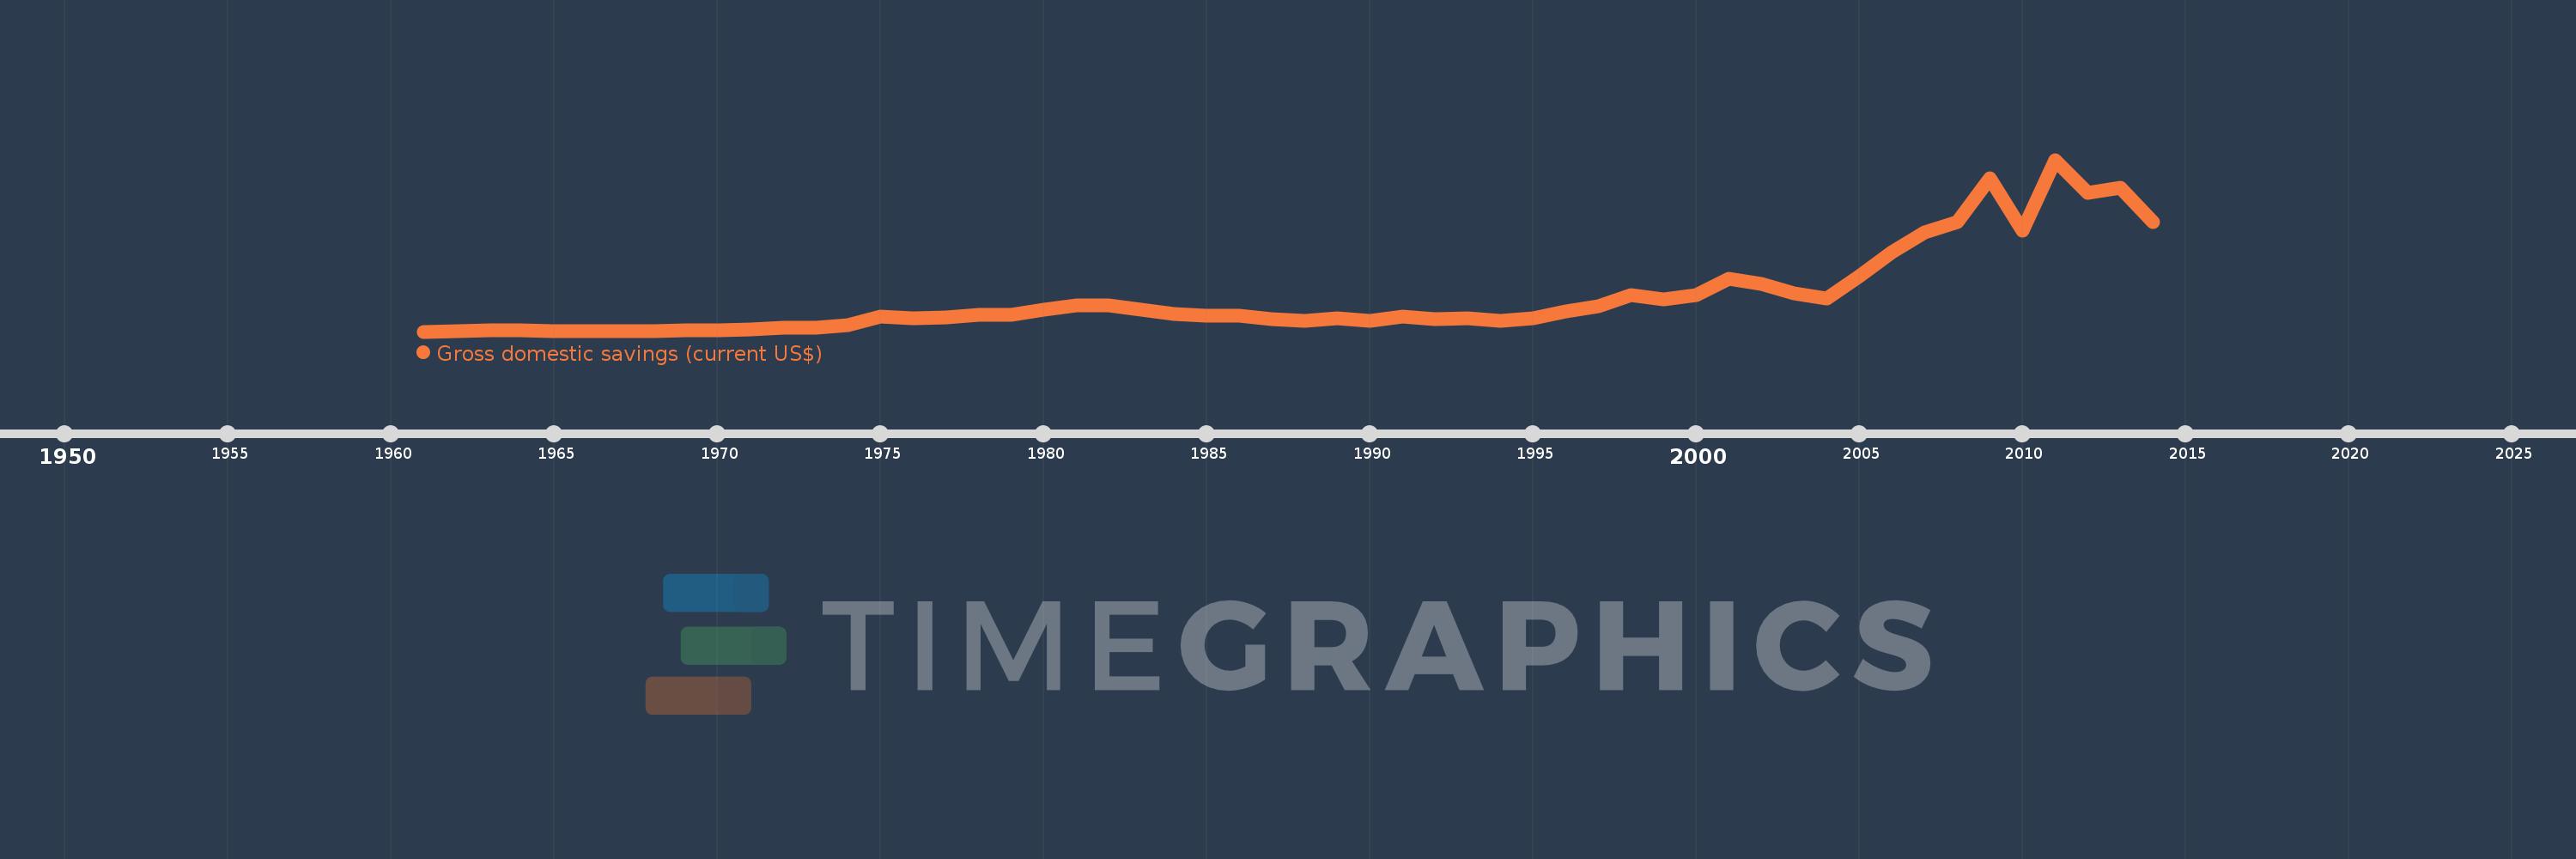
Gross domestic savings (current US$)
2014,2013,2012,2011,2010,2009,2008,2007,2006,2005,2004,2003,2002,2001,2000,1999,1998,1997,1996,1995,1994,1993,1992,1991,1990,1989,1988,1987,1986,1985,1984,1983,1982,1981,1980,1979,1978,1977,1976,1975,1974,1973,1972,1971,1970,1969,1968,1967,1966,1965,1964,1963,1962,1961
Estas estadísticas en otros países:
AfghanistanAlbaniaAlgeriaAngolaAntigua and BarbudaArab WorldArgentinaArmeniaArubaAustraliaAustriaAzerbaijanBahamas, TheBahrainBangladeshBarbadosBelarusBelgiumBelizeBeninBermudaBhutanBoliviaBosnia and HerzegovinaBotswanaBrazilBrunei DarussalamBulgariaBurkina FasoBurundiCabo VerdeCambodiaCameroonCanadaCaribbean small statesCentral African RepublicCentral Europe and the BalticsChadChileChinaColombiaComorosCongo, Dem. Rep.Congo, Rep.Costa RicaCote d'IvoireCroatiaCubaCyprusCzech RepublicDenmarkDjiboutiDominicaDominican RepublicEarly-demographic dividendEast Asia & PacificEast Asia & Pacific (excluding high income)East Asia & Pacific (IDA & IBRD countries)EcuadorEgypt, Arab Rep.El SalvadorEquatorial GuineaEritreaEstoniaEthiopiaEuro areaEurope & Central AsiaEurope & Central Asia (excluding high income)Europe & Central Asia (IDA & IBRD countries)European UnionFaroe IslandsFijiFinlandFragile and conflict affected situationsFranceGabonGambia, TheGeorgiaGermanyGhanaGreeceGrenadaGuatemalaGuineaGuinea-BissauGuyanaHaitiHeavily indebted poor countries (HIPC)High incomeHondurasHong Kong SAR, ChinaHungaryIBRD onlyIcelandIDA & IBRD totalIDA blendIDA onlyIDA totalIndiaIndonesiaIran, Islamic Rep.IraqIrelandIsraelItalyJamaicaJapanJordanKazakhstanKenyaKiribatiKorea, Rep.KosovoKuwaitKyrgyz RepublicLao PDRLate-demographic dividendLatin America & Caribbean Latin America & Caribbean (excluding high income)Latin America & the Caribbean (IDA & IBRD countries)LatviaLeast developed countries: UN classificationLebanonLesothoLiberiaLibyaLithuaniaLow & middle incomeLow incomeLower middle incomeLuxembourgMacao SAR, ChinaMacedonia, FYRMadagascarMalawiMalaysiaMaldivesMaliMaltaMauritaniaMauritiusMexicoMicronesia, Fed. Sts.Middle East & North AfricaMiddle East & North Africa (excluding high income)Middle East & North Africa (IDA & IBRD countries)Middle incomeMoldovaMongoliaMontenegroMoroccoMozambiqueNamibiaNepalNetherlandsNew CaledoniaNew ZealandNicaraguaNigerNigeriaNorth AmericaNorwayOECD membersOmanOther small statesPakistanPanamaPapua New GuineaParaguayPeruPhilippinesPolandPortugalPost-demographic dividendPre-demographic dividendPuerto RicoQatarRomaniaRussian FederationRwandaSaudi ArabiaSenegalSerbiaSeychellesSierra LeoneSingaporeSlovak RepublicSloveniaSmall statesSolomon IslandsSouth AfricaSouth AsiaSouth Asia (IDA & IBRD)South SudanSpainSri LankaSt. Kitts and NevisSt. LuciaSt. Vincent and the GrenadinesSub-Saharan Africa Sub-Saharan Africa (excluding high income)Sub-Saharan Africa (IDA & IBRD countries)SudanSurinameSwazilandSwedenSwitzerlandSyrian Arab RepublicTajikistanTanzaniaThailandTimor-LesteTogoTongaTrinidad and TobagoTunisiaTurkeyTurkmenistanUgandaUkraineUnited Arab EmiratesUnited KingdomUnited StatesUpper middle incomeUruguayUzbekistanVanuatuVenezuela, RBVietnamWest Bank and GazaWorldYemen, Rep.ZambiaZimbabwe línea de tiempo (timeline):
En esta escala de tiempo se presenta un gráfico de 1961 y 2014 de Venezuela, RB. Los datos de 1960 están ausentes. El número de observaciones reales por fecha: 54.
Fuente (nombre):
Indicadores del desarrollo mundial
Fuente (organización):
World Bank national accounts data, and OECD National Accounts data files.
Categorías:
Economy & Growth
Se ha actualizado:
23 abr 2017 año
Los indicadores de los cambios de valor en los últimos años
Mínimo:
2.867 bn
1 ene 1961 año
Máximo:
129.543 bn
1 ene 2011 año
A la fecha de observación
Valor
Cambio absoluto
El cambio con respecto al valor anterior
1 ene 1961 año
2.867 bn
+2.867 bn
0.0%
1 ene 1962 año
3.159 bn
+292.061 millones
10.19%
1 ene 1963 año
3.562 bn
+403.394 millones
12.77%
1 ene 1964 año
3.823 bn
+261.121 millones
7.33%
1 ene 1965 año
3.337 bn
-486.72 millones
-12.73%
1 ene 1966 año
3.196 bn
-141.193 millones
-4.23%
1 ene 1967 año
3.318 bn
+122.6 millones
3.84%
1 ene 1968 año
3.389 bn
+70.956 millones
2.14%
1 ene 1969 año
3.838 bn
+449.422 millones
13.26%
1 ene 1970 año
3.968 bn
+129.044 millones
3.36%
1 ene 1971 año
4.742 bn
+774.156 millones
19.51%
1 ene 1972 año
5.52 bn
+778.538 millones
16.42%
1 ene 1973 año
5.74 bn
+219.932 millones
3.98%
1 ene 1974 año
7.651 bn
+1.911 bn
33.3%
1 ene 1975 año
13.953 bn
+6.301 bn
82.35%
1 ene 1976 año
12.422 bn
-1.53 bn
-10.97%
1 ene 1977 año
13.345 bn
+922.698 millones
7.43%
1 ene 1978 año
15.325 bn
+1.98 bn
14.84%
1 ene 1979 año
15.213 bn
-112.535 millones
-0.73%
1 ene 1980 año
19.196 bn
+3.983 bn
26.18%
1 ene 1981 año
22.347 bn
+3.151 bn
16.41%
1 ene 1982 año
22.122 bn
-225.047 millones
-1.01%
1 ene 1983 año
19.196 bn
-2.926 bn
-13.22%
1 ene 1984 año
16.113 bn
-3.083 bn
-16.06%
1 ene 1985 año
14.67 bn
-1.444 bn
-8.96%
1 ene 1986 año
14.6 bn
-69.253 millones
-0.47%
1 ene 1987 año
11.984 bn
-2.616 bn
-17.92%
1 ene 1988 año
10.543 bn
-1.441 bn
-12.03%
1 ene 1989 año
12.401 bn
+1.858 bn
17.62%
1 ene 1990 año
10.84 bn
-1.561 bn
-12.59%
1 ene 1991 año
13.867 bn
+3.027 bn
27.92%
1 ene 1992 año
12.319 bn
-1.548 bn
-11.16%
1 ene 1993 año
12.371 bn
+52.752 millones
0.43%
1 ene 1994 año
10.769 bn
-1.602 bn
-12.95%
1 ene 1995 año
12.844 bn
+2.075 bn
19.27%
1 ene 1996 año
17.532 bn
+4.688 bn
36.5%
1 ene 1997 año
21.668 bn
+4.136 bn
23.59%
1 ene 1998 año
29.998 bn
+8.33 bn
38.45%
1 ene 1999 año
26.397 bn
-3.602 bn
-12.01%
1 ene 2000 año
29.658 bn
+3.261 bn
12.35%
1 ene 2001 año
41.938 bn
+12.281 bn
41.41%
1 ene 2002 año
37.921 bn
-4.017 bn
-9.58%
1 ene 2003 año
31.073 bn
-6.848 bn
-18.06%
1 ene 2004 año
27.049 bn
-4.024 bn
-12.95%
1 ene 2005 año
43.663 bn
+16.614 bn
61.42%
1 ene 2006 año
61.397 bn
+17.733 bn
40.61%
1 ene 2007 año
75.764 bn
+14.368 bn
23.4%
1 ene 2008 año
83.857 bn
+8.093 bn
10.68%
1 ene 2009 año
115.637 bn
+31.78 bn
37.9%
1 ene 2010 año
77.147 bn
-38.491 bn
-33.29%
1 ene 2011 año
129.543 bn
+52.396 bn
67.92%
1 ene 2012 año
105.453 bn
-24.09 bn
-18.6%
1 ene 2013 año
108.801 bn
+3.348 bn
3.17%
1 ene 2014 año
83.629 bn
-25.172 bn
-23.14%
Ranking de los países por los datos estadísticos actuales


Comentarios: