29
/es/
es
AIzaSyAYiBZKx7MnpbEhh9jyipgxe19OcubqV5w
April 1, 2024
104924
Chile
CHL
true
2
1
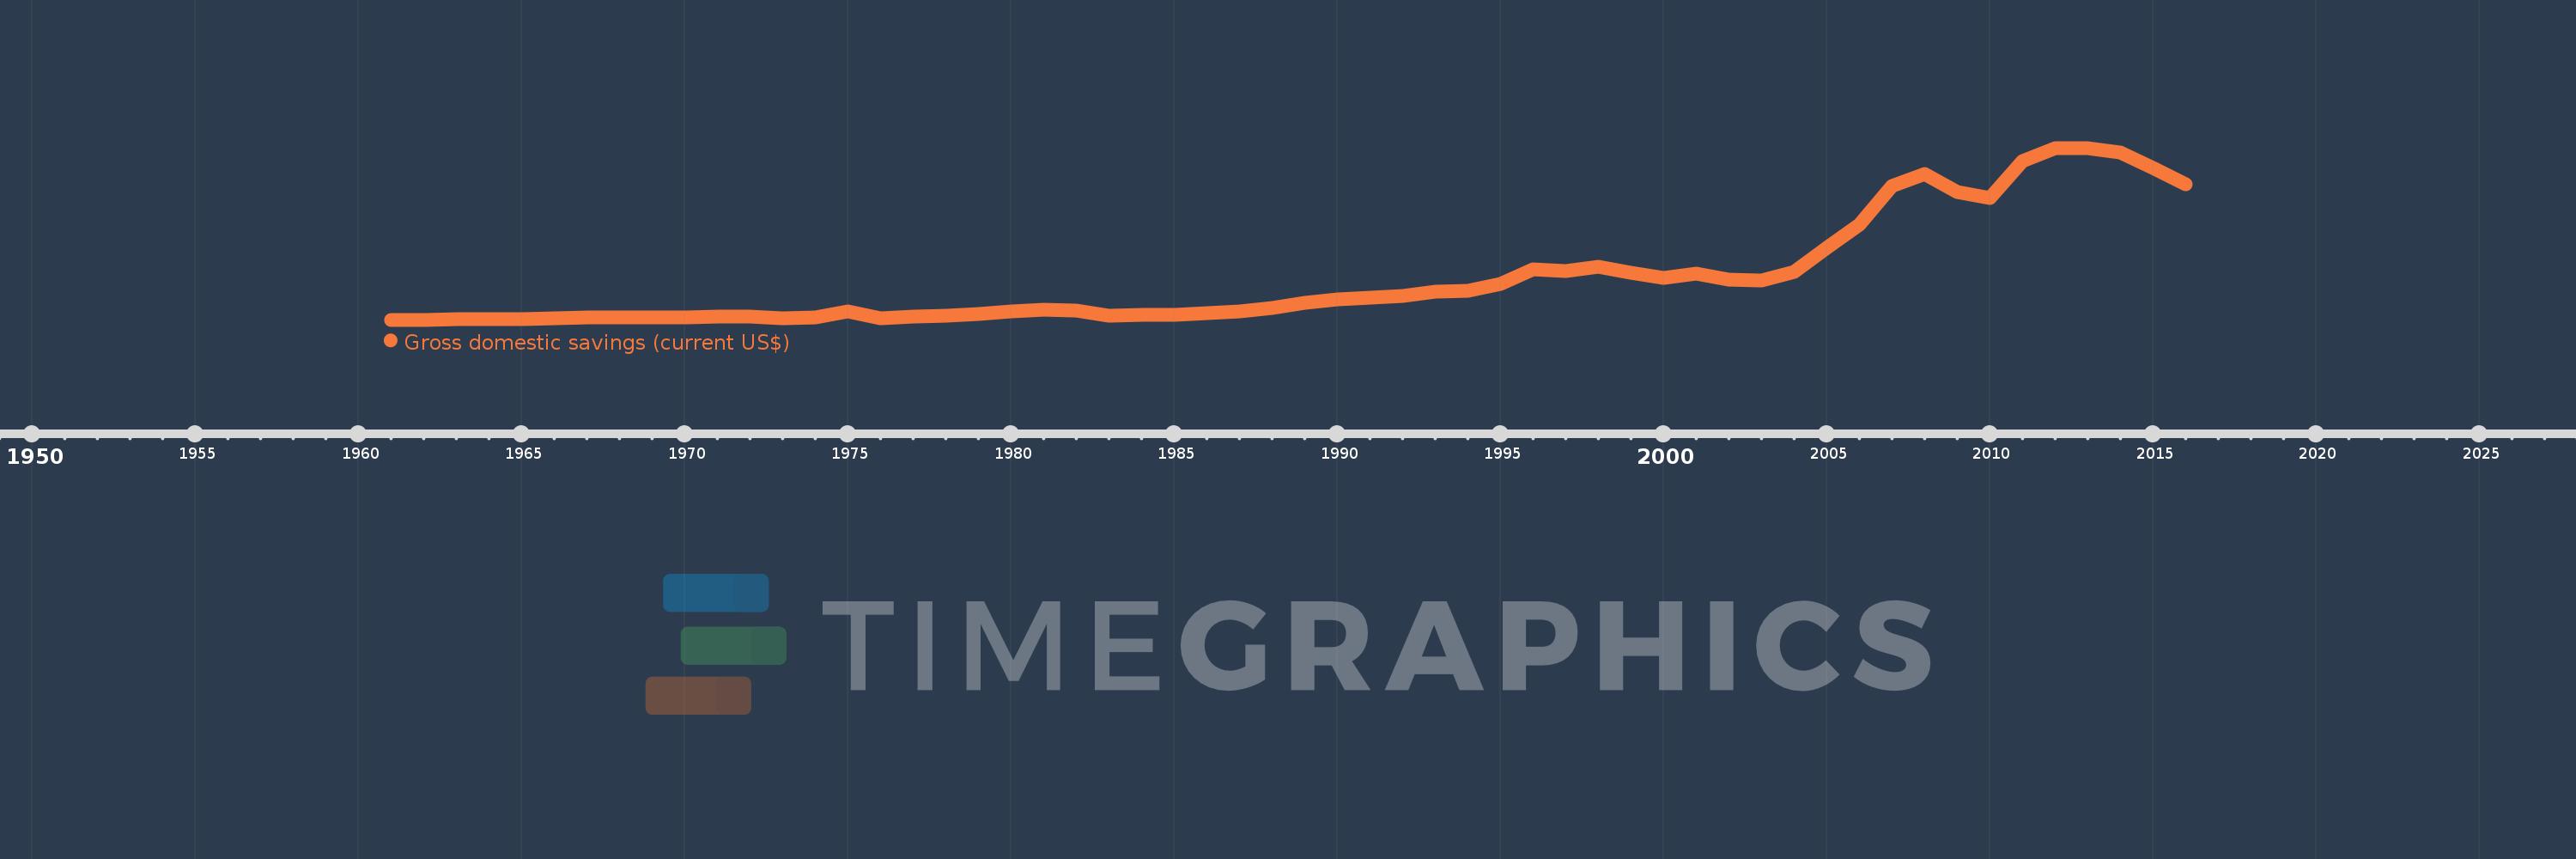
Gross domestic savings (current US$)
2016,2015,2014,2013,2012,2011,2010,2009,2008,2007,2006,2005,2004,2003,2002,2001,2000,1999,1998,1997,1996,1995,1994,1993,1992,1991,1990,1989,1988,1987,1986,1985,1984,1983,1982,1981,1980,1979,1978,1977,1976,1975,1974,1973,1972,1971,1970,1969,1968,1967,1966,1965,1964,1963,1962,1961
Estas estadísticas en otros países:
AfghanistanAlbaniaAlgeriaAngolaAntigua and BarbudaArab WorldArgentinaArmeniaArubaAustraliaAustriaAzerbaijanBahamas, TheBahrainBangladeshBarbadosBelarusBelgiumBelizeBeninBermudaBhutanBoliviaBosnia and HerzegovinaBotswanaBrazilBrunei DarussalamBulgariaBurkina FasoBurundiCabo VerdeCambodiaCameroonCanadaCaribbean small statesCentral African RepublicCentral Europe and the BalticsChadChileChinaColombiaComorosCongo, Dem. Rep.Congo, Rep.Costa RicaCote d'IvoireCroatiaCubaCyprusCzech RepublicDenmarkDjiboutiDominicaDominican RepublicEarly-demographic dividendEast Asia & PacificEast Asia & Pacific (excluding high income)East Asia & Pacific (IDA & IBRD countries)EcuadorEgypt, Arab Rep.El SalvadorEquatorial GuineaEritreaEstoniaEthiopiaEuro areaEurope & Central AsiaEurope & Central Asia (excluding high income)Europe & Central Asia (IDA & IBRD countries)European UnionFaroe IslandsFijiFinlandFragile and conflict affected situationsFranceGabonGambia, TheGeorgiaGermanyGhanaGreeceGrenadaGuatemalaGuineaGuinea-BissauGuyanaHaitiHeavily indebted poor countries (HIPC)High incomeHondurasHong Kong SAR, ChinaHungaryIBRD onlyIcelandIDA & IBRD totalIDA blendIDA onlyIDA totalIndiaIndonesiaIran, Islamic Rep.IraqIrelandIsraelItalyJamaicaJapanJordanKazakhstanKenyaKiribatiKorea, Rep.KosovoKuwaitKyrgyz RepublicLao PDRLate-demographic dividendLatin America & Caribbean Latin America & Caribbean (excluding high income)Latin America & the Caribbean (IDA & IBRD countries)LatviaLeast developed countries: UN classificationLebanonLesothoLiberiaLibyaLithuaniaLow & middle incomeLow incomeLower middle incomeLuxembourgMacao SAR, ChinaMacedonia, FYRMadagascarMalawiMalaysiaMaldivesMaliMaltaMauritaniaMauritiusMexicoMicronesia, Fed. Sts.Middle East & North AfricaMiddle East & North Africa (excluding high income)Middle East & North Africa (IDA & IBRD countries)Middle incomeMoldovaMongoliaMontenegroMoroccoMozambiqueNamibiaNepalNetherlandsNew CaledoniaNew ZealandNicaraguaNigerNigeriaNorth AmericaNorwayOECD membersOmanOther small statesPakistanPanamaPapua New GuineaParaguayPeruPhilippinesPolandPortugalPost-demographic dividendPre-demographic dividendPuerto RicoQatarRomaniaRussian FederationRwandaSaudi ArabiaSenegalSerbiaSeychellesSierra LeoneSingaporeSlovak RepublicSloveniaSmall statesSolomon IslandsSouth AfricaSouth AsiaSouth Asia (IDA & IBRD)South SudanSpainSri LankaSt. Kitts and NevisSt. LuciaSt. Vincent and the GrenadinesSub-Saharan Africa Sub-Saharan Africa (excluding high income)Sub-Saharan Africa (IDA & IBRD countries)SudanSurinameSwazilandSwedenSwitzerlandSyrian Arab RepublicTajikistanTanzaniaThailandTimor-LesteTogoTongaTrinidad and TobagoTunisiaTurkeyTurkmenistanUgandaUkraineUnited Arab EmiratesUnited KingdomUnited StatesUpper middle incomeUruguayUzbekistanVanuatuVenezuela, RBVietnamWest Bank and GazaWorldYemen, Rep.ZambiaZimbabwe línea de tiempo (timeline):
En esta escala de tiempo se presenta un gráfico de 1961 y 2016 de Chile. Los datos de 1960 están ausentes. El número de observaciones reales por fecha: 56.
Fuente (nombre):
Indicadores del desarrollo mundial
Fuente (organización):
World Bank national accounts data, and OECD National Accounts data files.
Categorías:
Economy & Growth
Se ha actualizado:
23 abr 2017 año
Los indicadores de los cambios de valor en los últimos años
Mínimo:
612.455 millones
1 ene 1961 año
Máximo:
67.425 bn
1 ene 2012 año
A la fecha de observación
Valor
Cambio absoluto
El cambio con respecto al valor anterior
1 ene 1961 año
612.455 millones
+612.455 millones
0.0%
1 ene 1962 año
638.545 millones
+26.091 millones
4.26%
1 ene 1963 año
733.818 millones
+95.273 millones
14.92%
1 ene 1964 año
883.25 millones
+149.432 millones
20.36%
1 ene 1965 año
976.0 millones
+92.75 millones
10.5%
1 ene 1966 año
1.153 bn
+177.125 millones
18.15%
1 ene 1967 año
1.387 bn
+234.054 millones
20.3%
1 ene 1968 año
1.367 bn
-20.513 millones
-1.48%
1 ene 1969 año
1.397 bn
+30.435 millones
2.23%
1 ene 1970 año
1.645 bn
+248.247 millones
17.77%
1 ene 1971 año
1.774 bn
+128.987 millones
7.84%
1 ene 1972 año
1.734 bn
-39.91 millones
-2.25%
1 ene 1973 año
1.304 bn
-430.099 millones
-24.8%
1 ene 1974 año
1.419 bn
+114.807 millones
8.8%
1 ene 1975 año
3.964 bn
+2.545 bn
179.34%
1 ene 1976 año
1.084 bn
-2.881 bn
-72.67%
1 ene 1977 año
1.974 bn
+890.198 millones
82.15%
1 ene 1978 año
2.077 bn
+102.876 millones
5.21%
1 ene 1979 año
2.724 bn
+646.987 millones
31.16%
1 ene 1980 año
3.778 bn
+1.055 bn
38.72%
1 ene 1981 año
4.65 bn
+871.75 millones
23.07%
1 ene 1982 año
4.035 bn
-614.769 millones
-13.22%
1 ene 1983 año
2.287 bn
-1.748 bn
-43.32%
1 ene 1984 año
2.48 bn
+193.171 millones
8.45%
1 ene 1985 año
2.417 bn
-63.263 millones
-2.55%
1 ene 1986 año
3.236 bn
+818.723 millones
33.87%
1 ene 1987 año
3.889 bn
+653.086 millones
20.18%
1 ene 1988 año
5.242 bn
+1.353 bn
34.78%
1 ene 1989 año
7.315 bn
+2.073 bn
39.55%
1 ene 1990 año
8.517 bn
+1.203 bn
16.44%
1 ene 1991 año
9.032 bn
+514.39 millones
6.04%
1 ene 1992 año
9.837 bn
+805.158 millones
8.91%
1 ene 1993 año
11.462 bn
+1.625 bn
16.51%
1 ene 1994 año
11.893 bn
+431.122 millones
3.76%
1 ene 1995 año
14.625 bn
+2.732 bn
22.97%
1 ene 1996 año
20.252 bn
+5.628 bn
38.48%
1 ene 1997 año
19.468 bn
-784.088 millones
-3.87%
1 ene 1998 año
21.202 bn
+1.733 bn
8.9%
1 ene 1999 año
18.758 bn
-2.444 bn
-11.53%
1 ene 2000 año
16.917 bn
-1.842 bn
-9.82%
1 ene 2001 año
18.601 bn
+1.685 bn
9.96%
1 ene 2002 año
16.098 bn
-2.503 bn
-13.46%
1 ene 2003 año
15.944 bn
-154.271 millones
-0.96%
1 ene 2004 año
19.344 bn
+3.4 bn
21.32%
1 ene 2005 año
28.485 bn
+9.141 bn
47.25%
1 ene 2006 año
37.44 bn
+8.955 bn
31.44%
1 ene 2007 año
52.642 bn
+15.202 bn
40.6%
1 ene 2008 año
57.277 bn
+4.635 bn
8.81%
1 ene 2009 año
50.172 bn
-7.105 bn
-12.41%
1 ene 2010 año
47.902 bn
-2.27 bn
-4.52%
1 ene 2011 año
62.383 bn
+14.481 bn
30.23%
1 ene 2012 año
67.425 bn
+5.042 bn
8.08%
1 ene 2013 año
67.195 bn
-229.308 millones
-0.34%
1 ene 2014 año
65.561 bn
-1.635 bn
-2.43%
1 ene 2015 año
59.639 bn
-5.921 bn
-9.03%
1 ene 2016 año
53.226 bn
-6.413 bn
-10.75%
Ranking de los países por los datos estadísticos actuales


Comentarios: