29
/es/
es
AIzaSyAYiBZKx7MnpbEhh9jyipgxe19OcubqV5w
April 1, 2024
117952
Czech Republic
CZE
true
2
1
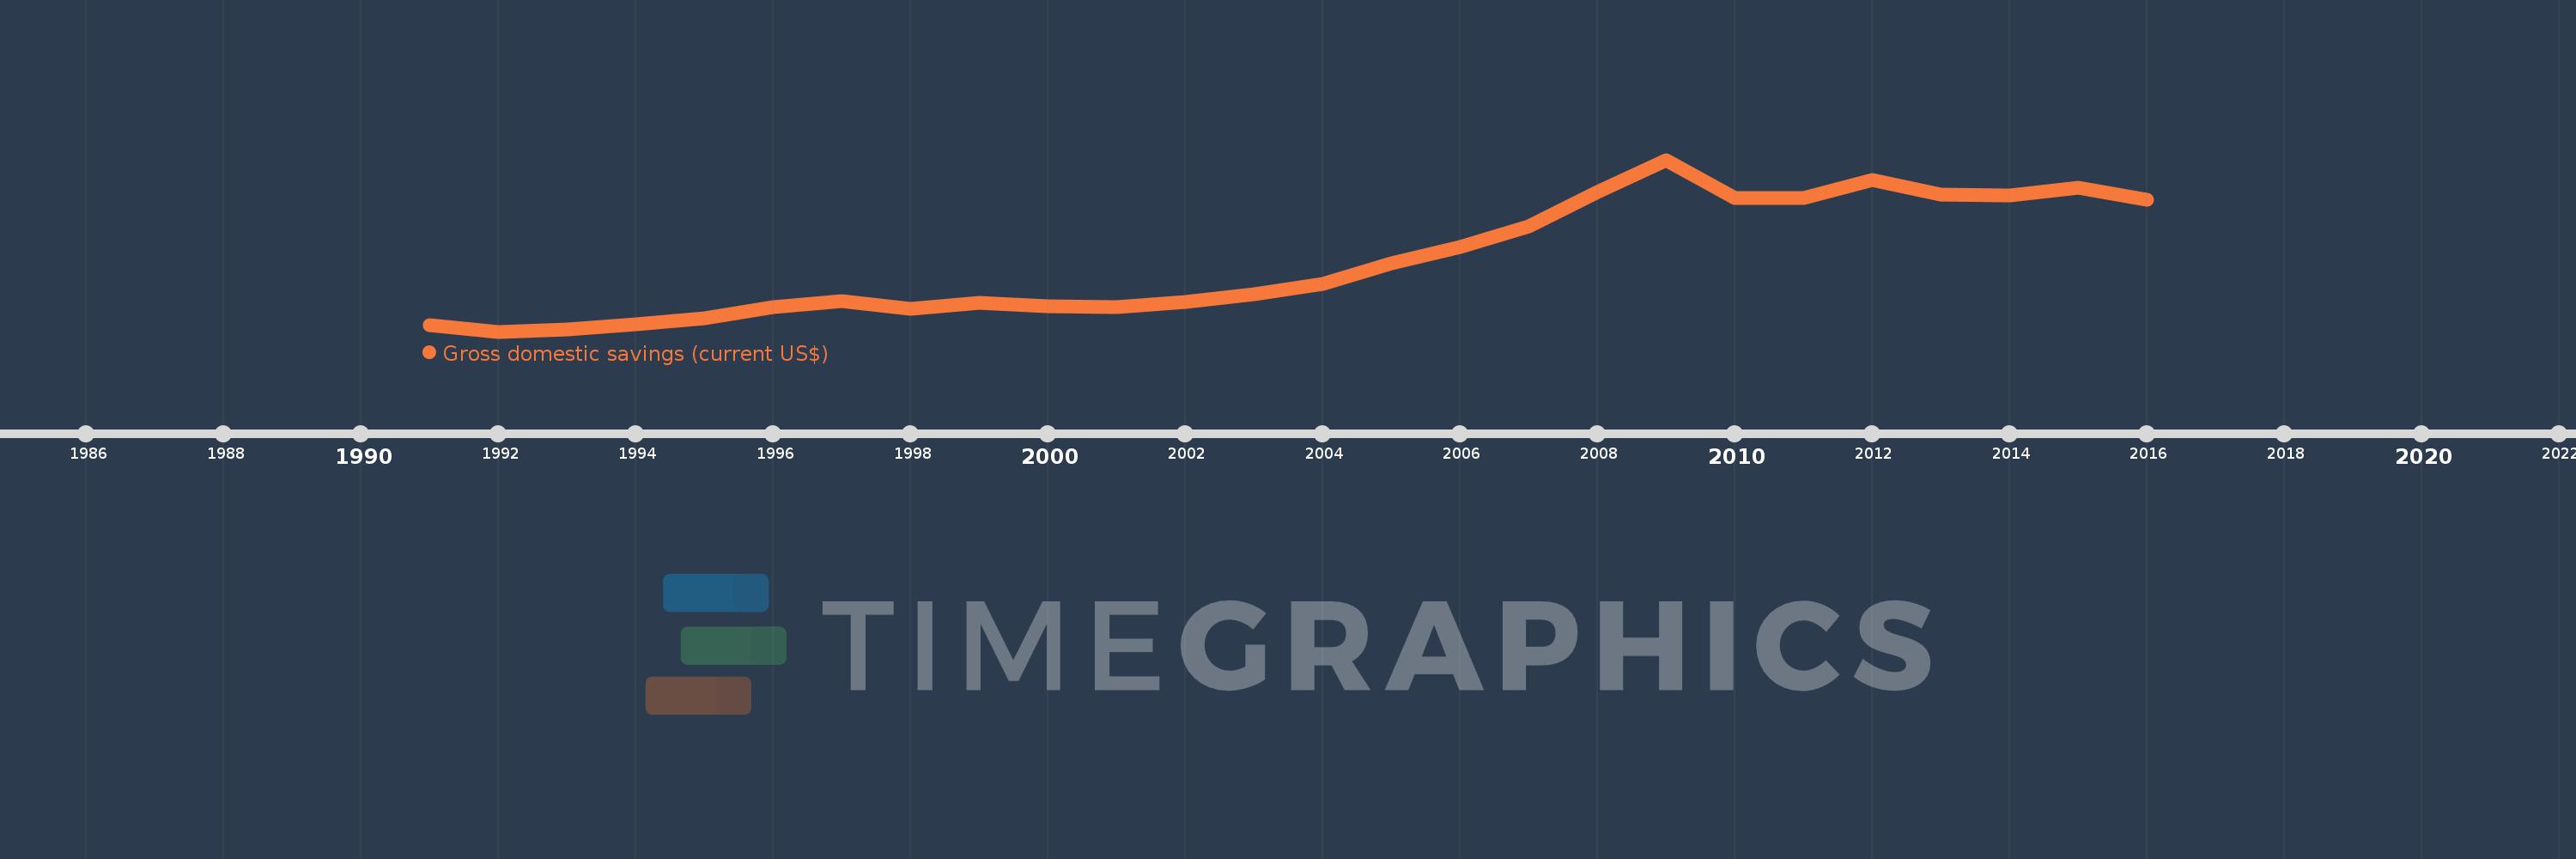
Gross domestic savings (current US$)
2016,2015,2014,2013,2012,2011,2010,2009,2008,2007,2006,2005,2004,2003,2002,2001,2000,1999,1998,1997,1996,1995,1994,1993,1992,1991
Estas estadísticas en otros países:
AfghanistanAlbaniaAlgeriaAngolaAntigua and BarbudaArab WorldArgentinaArmeniaArubaAustraliaAustriaAzerbaijanBahamas, TheBahrainBangladeshBarbadosBelarusBelgiumBelizeBeninBermudaBhutanBoliviaBosnia and HerzegovinaBotswanaBrazilBrunei DarussalamBulgariaBurkina FasoBurundiCabo VerdeCambodiaCameroonCanadaCaribbean small statesCentral African RepublicCentral Europe and the BalticsChadChileChinaColombiaComorosCongo, Dem. Rep.Congo, Rep.Costa RicaCote d'IvoireCroatiaCubaCyprusCzech RepublicDenmarkDjiboutiDominicaDominican RepublicEarly-demographic dividendEast Asia & PacificEast Asia & Pacific (excluding high income)East Asia & Pacific (IDA & IBRD countries)EcuadorEgypt, Arab Rep.El SalvadorEquatorial GuineaEritreaEstoniaEthiopiaEuro areaEurope & Central AsiaEurope & Central Asia (excluding high income)Europe & Central Asia (IDA & IBRD countries)European UnionFaroe IslandsFijiFinlandFragile and conflict affected situationsFranceGabonGambia, TheGeorgiaGermanyGhanaGreeceGrenadaGuatemalaGuineaGuinea-BissauGuyanaHaitiHeavily indebted poor countries (HIPC)High incomeHondurasHong Kong SAR, ChinaHungaryIBRD onlyIcelandIDA & IBRD totalIDA blendIDA onlyIDA totalIndiaIndonesiaIran, Islamic Rep.IraqIrelandIsraelItalyJamaicaJapanJordanKazakhstanKenyaKiribatiKorea, Rep.KosovoKuwaitKyrgyz RepublicLao PDRLate-demographic dividendLatin America & Caribbean Latin America & Caribbean (excluding high income)Latin America & the Caribbean (IDA & IBRD countries)LatviaLeast developed countries: UN classificationLebanonLesothoLiberiaLibyaLithuaniaLow & middle incomeLow incomeLower middle incomeLuxembourgMacao SAR, ChinaMacedonia, FYRMadagascarMalawiMalaysiaMaldivesMaliMaltaMauritaniaMauritiusMexicoMicronesia, Fed. Sts.Middle East & North AfricaMiddle East & North Africa (excluding high income)Middle East & North Africa (IDA & IBRD countries)Middle incomeMoldovaMongoliaMontenegroMoroccoMozambiqueNamibiaNepalNetherlandsNew CaledoniaNew ZealandNicaraguaNigerNigeriaNorth AmericaNorwayOECD membersOmanOther small statesPakistanPanamaPapua New GuineaParaguayPeruPhilippinesPolandPortugalPost-demographic dividendPre-demographic dividendPuerto RicoQatarRomaniaRussian FederationRwandaSaudi ArabiaSenegalSerbiaSeychellesSierra LeoneSingaporeSlovak RepublicSloveniaSmall statesSolomon IslandsSouth AfricaSouth AsiaSouth Asia (IDA & IBRD)South SudanSpainSri LankaSt. Kitts and NevisSt. LuciaSt. Vincent and the GrenadinesSub-Saharan Africa Sub-Saharan Africa (excluding high income)Sub-Saharan Africa (IDA & IBRD countries)SudanSurinameSwazilandSwedenSwitzerlandSyrian Arab RepublicTajikistanTanzaniaThailandTimor-LesteTogoTongaTrinidad and TobagoTunisiaTurkeyTurkmenistanUgandaUkraineUnited Arab EmiratesUnited KingdomUnited StatesUpper middle incomeUruguayUzbekistanVanuatuVenezuela, RBVietnamWest Bank and GazaWorldYemen, Rep.ZambiaZimbabwe línea de tiempo (timeline):
En esta escala de tiempo se presenta un gráfico de 1991 y 2016 de Czech Republic. Los datos de 1990 están ausentes. El número de observaciones reales por fecha: 26.
Fuente (nombre):
Indicadores del desarrollo mundial
Fuente (organización):
World Bank national accounts data, and OECD National Accounts data files.
Categorías:
Economy & Growth
Se ha actualizado:
23 abr 2017 año
Los indicadores de los cambios de valor en los últimos años
Mínimo:
8.246 bn
1 ene 1992 año
Máximo:
78.286 bn
1 ene 2009 año
A la fecha de observación
Valor
Cambio absoluto
El cambio con respecto al valor anterior
1 ene 1991 año
10.761 bn
+10.761 bn
0.0%
1 ene 1992 año
8.246 bn
-2.515 bn
-23.37%
1 ene 1993 año
9.163 bn
+917.162 millones
11.12%
1 ene 1994 año
11.162 bn
+1.999 bn
21.81%
1 ene 1995 año
13.56 bn
+2.398 bn
21.48%
1 ene 1996 año
18.311 bn
+4.752 bn
35.04%
1 ene 1997 año
20.574 bn
+2.263 bn
12.36%
1 ene 1998 año
17.383 bn
-3.192 bn
-15.51%
1 ene 1999 año
19.965 bn
+2.582 bn
14.86%
1 ene 2000 año
18.646 bn
-1.319 bn
-6.61%
1 ene 2001 año
18.226 bn
-420.578 millones
-2.26%
1 ene 2002 año
20.457 bn
+2.231 bn
12.24%
1 ene 2003 año
23.637 bn
+3.18 bn
15.54%
1 ene 2004 año
27.767 bn
+4.13 bn
17.47%
1 ene 2005 año
35.933 bn
+8.166 bn
29.41%
1 ene 2006 año
42.867 bn
+6.935 bn
19.3%
1 ene 2007 año
50.981 bn
+8.114 bn
18.93%
1 ene 2008 año
65.292 bn
+14.311 bn
28.07%
1 ene 2009 año
78.286 bn
+12.994 bn
19.9%
1 ene 2010 año
62.541 bn
-15.745 bn
-20.11%
1 ene 2011 año
62.67 bn
+129.452 millones
0.21%
1 ene 2012 año
70.178 bn
+7.508 bn
11.98%
1 ene 2013 año
64.262 bn
-5.916 bn
-8.43%
1 ene 2014 año
63.723 bn
-539.714 millones
-0.84%
1 ene 2015 año
67.011 bn
+3.288 bn
5.16%
1 ene 2016 año
62.004 bn
-5.006 bn
-7.47%
Ranking de los países por los datos estadísticos actuales


Comentarios: