29
/es/
es
AIzaSyAYiBZKx7MnpbEhh9jyipgxe19OcubqV5w
April 1, 2024
63730
Afghanistan
AFG
true
2
1
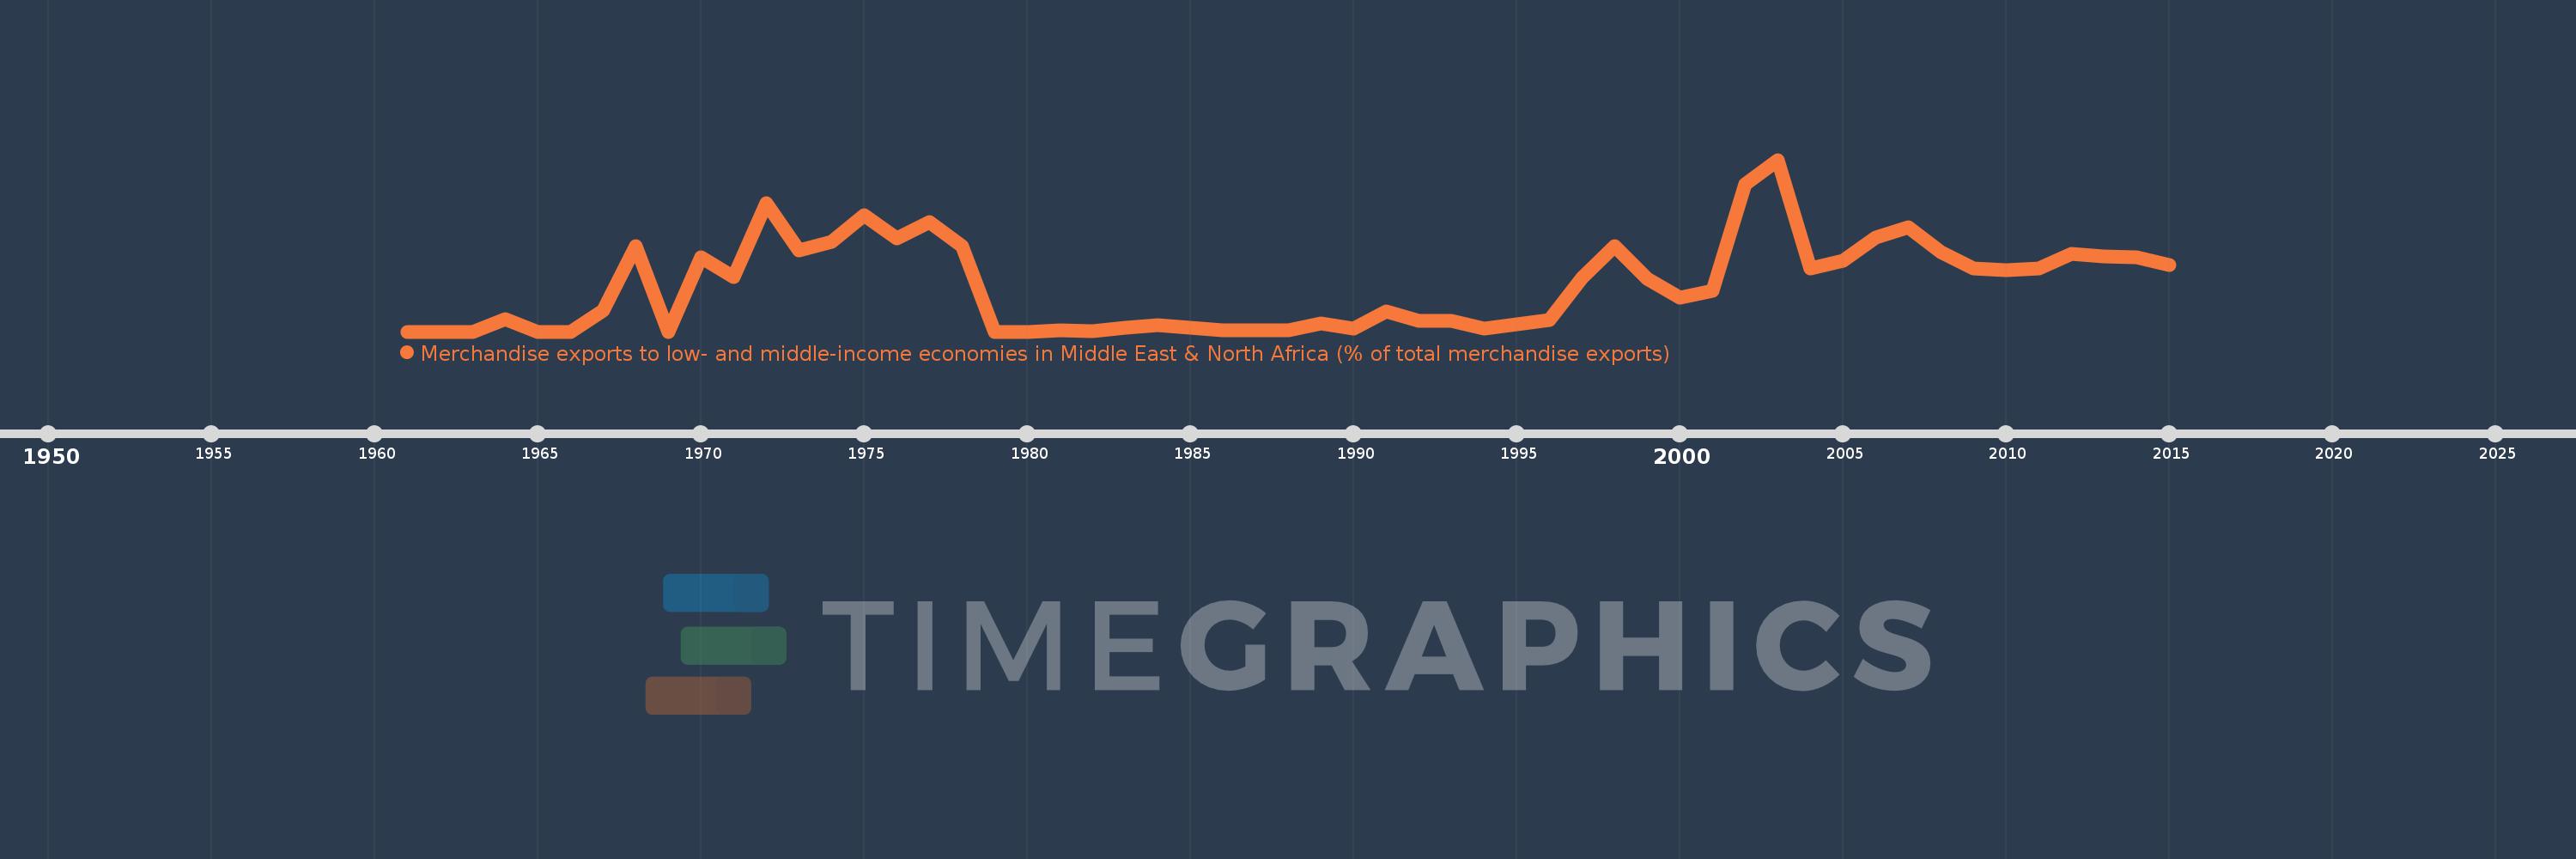
Merchandise exports to low- and middle-income economies in Middle East & North Africa (% of total merchandise exports)
2015,2014,2013,2012,2011,2010,2009,2008,2007,2006,2005,2004,2003,2002,2001,2000,1999,1998,1997,1996,1995,1994,1993,1992,1991,1990,1989,1988,1987,1986,1985,1984,1983,1982,1981,1980,1979,1978,1977,1976,1975,1974,1973,1972,1971,1970,1969,1968,1967,1966,1965,1964,1963,1962,1961
Estas estadísticas en otros países:
AfghanistanAlbaniaAlgeriaAngolaArab WorldArgentinaArmeniaArubaAustraliaAustriaAzerbaijanBahamas, TheBahrainBangladeshBarbadosBelarusBelgiumBelizeBeninBermudaBoliviaBosnia and HerzegovinaBrazilBrunei DarussalamBulgariaBurkina FasoBurundiCabo VerdeCambodiaCameroonCanadaCaribbean small statesCentral African RepublicCentral Europe and the BalticsChadChileChinaColombiaComorosCongo, Dem. Rep.Congo, Rep.Costa RicaCote d'IvoireCroatiaCubaCyprusCzech RepublicDenmarkDjiboutiDominicaDominican RepublicEarly-demographic dividendEast Asia & PacificEast Asia & Pacific (excluding high income)East Asia & Pacific (IDA & IBRD countries)EcuadorEgypt, Arab Rep.El SalvadorEquatorial GuineaEstoniaEthiopiaEuro areaEurope & Central AsiaEurope & Central Asia (excluding high income)Europe & Central Asia (IDA & IBRD countries)European UnionFijiFinlandFragile and conflict affected situationsFranceGabonGambia, TheGeorgiaGermanyGhanaGreeceGreenlandGrenadaGuatemalaGuineaGuinea-BissauGuyanaHaitiHeavily indebted poor countries (HIPC)High incomeHondurasHong Kong SAR, ChinaHungaryIBRD onlyIcelandIDA & IBRD totalIDA blendIDA onlyIDA totalIndiaIndonesiaIran, Islamic Rep.IraqIrelandIsraelItalyJamaicaJapanJordanKazakhstanKenyaKorea, Dem. People’s Rep.Korea, Rep.KosovoKuwaitKyrgyz RepublicLao PDRLate-demographic dividendLatin America & Caribbean Latin America & Caribbean (excluding high income)Latin America & the Caribbean (IDA & IBRD countries)LatviaLeast developed countries: UN classificationLebanonLiberiaLibyaLithuaniaLow & middle incomeLow incomeLower middle incomeLuxembourgMacao SAR, ChinaMacedonia, FYRMadagascarMalawiMalaysiaMaliMaltaMauritaniaMauritiusMexicoMiddle East & North AfricaMiddle East & North Africa (excluding high income)Middle East & North Africa (IDA & IBRD countries)Middle incomeMoldovaMongoliaMontenegroMoroccoMozambiqueMyanmarNepalNetherlandsNew CaledoniaNew ZealandNicaraguaNigerNigeriaNorth AmericaNorwayOECD membersOmanOther small statesPacific island small statesPakistanPanamaPapua New GuineaParaguayPeruPhilippinesPolandPortugalPost-demographic dividendPre-demographic dividendQatarRomaniaRussian FederationRwandaSamoaSaudi ArabiaSenegalSerbiaSeychellesSierra LeoneSingaporeSlovak RepublicSloveniaSmall statesSomaliaSouth AfricaSouth AsiaSouth Asia (IDA & IBRD)SpainSri LankaSt. LuciaSub-Saharan Africa Sub-Saharan Africa (excluding high income)Sub-Saharan Africa (IDA & IBRD countries)SudanSurinameSwedenSwitzerlandSyrian Arab RepublicTajikistanTanzaniaThailandTogoTrinidad and TobagoTunisiaTurkeyTurkmenistanUgandaUkraineUnited Arab EmiratesUnited KingdomUnited StatesUpper middle incomeUruguayUzbekistanVenezuela, RBVietnamWorldYemen, Rep.ZambiaZimbabwe línea de tiempo (timeline):
En esta escala de tiempo se presenta un gráfico de 1961 y 2015 de Afghanistan. Los datos de 1960 están ausentes. El número de observaciones reales por fecha: 55.
Fuente (nombre):
Indicadores del desarrollo mundial
Fuente (organización):
World Bank staff estimates based data from International Monetary Fund's Direction of Trade database.
Categorías:
Private Sector, Trade
Se ha actualizado:
23 abr 2017 año
Los indicadores de los cambios de valor en los últimos años
Máximo:
7.834
1 ene 2003 año
A la fecha de observación
Valor
Cambio absoluto
El cambio con respecto al valor anterior
1 ene 1961 año
0.0
0.0
0.0%
1 ene 1964 año
0.571
+0.571
%
1 ene 1965 año
0.0
-0.571
-100.0%
1 ene 1967 año
0.978
+0.978
%
1 ene 1968 año
3.897
+2.92
298.63%
1 ene 1969 año
0.0
-3.897
-100.0%
1 ene 1970 año
3.376
+3.376
%
1 ene 1971 año
2.481
-0.894
-26.49%
1 ene 1972 año
5.843
+3.361
135.47%
1 ene 1973 año
3.712
-2.13
-36.46%
1 ene 1974 año
4.079
+0.366
9.87%
1 ene 1975 año
5.293
+1.214
29.76%
1 ene 1976 año
4.234
-1.059
-20.01%
1 ene 1977 año
4.994
+0.76
17.95%
1 ene 1978 año
3.906
-1.088
-21.79%
1 ene 1979 año
0.0
-3.906
-100.0%
1 ene 1981 año
0.065
+0.065
%
1 ene 1982 año
0.027
-0.038
-58.12%
1 ene 1983 año
0.191
+0.164
603.37%
1 ene 1984 año
0.279
+0.088
46.34%
1 ene 1985 año
0.167
-0.112
-40.24%
1 ene 1986 año
0.064
-0.102
-61.41%
1 ene 1987 año
0.077
+0.012
19.24%
1 ene 1988 año
0.063
-0.014
-17.94%
1 ene 1989 año
0.362
+0.299
474.81%
1 ene 1990 año
0.133
-0.229
-63.28%
1 ene 1991 año
0.921
+0.788
592.77%
1 ene 1992 año
0.483
-0.437
-47.48%
1 ene 1993 año
0.49
+0.007
1.43%
1 ene 1994 año
0.138
-0.352
-71.8%
1 ene 1995 año
0.323
+0.185
133.69%
1 ene 1996 año
0.547
+0.224
69.19%
1 ene 1997 año
2.454
+1.907
348.72%
1 ene 1998 año
3.879
+1.425
58.1%
1 ene 1999 año
2.402
-1.477
-38.07%
1 ene 2000 año
1.552
-0.85
-35.39%
1 ene 2001 año
1.867
+0.315
20.29%
1 ene 2002 año
6.716
+4.849
259.74%
1 ene 2003 año
7.834
+1.118
16.65%
1 ene 2004 año
2.889
-4.945
-63.12%
1 ene 2005 año
3.225
+0.337
11.65%
1 ene 2006 año
4.289
+1.064
32.98%
1 ene 2007 año
4.766
+0.477
11.13%
1 ene 2008 año
3.64
-1.126
-23.62%
1 ene 2009 año
2.894
-0.746
-20.49%
1 ene 2010 año
2.814
-0.081
-2.78%
1 ene 2011 año
2.866
+0.053
1.88%
1 ene 2012 año
3.536
+0.67
23.36%
1 ene 2013 año
3.424
-0.112
-3.16%
1 ene 2014 año
3.383
-0.041
-1.2%
1 ene 2015 año
3.035
-0.348
-10.28%
Ranking de los países por los datos estadísticos actuales


Comentarios: