29
/es/
es
AIzaSyAYiBZKx7MnpbEhh9jyipgxe19OcubqV5w
April 1, 2024
28332
East Asia & Pacific (excluding high income)
EAP
false
2
1
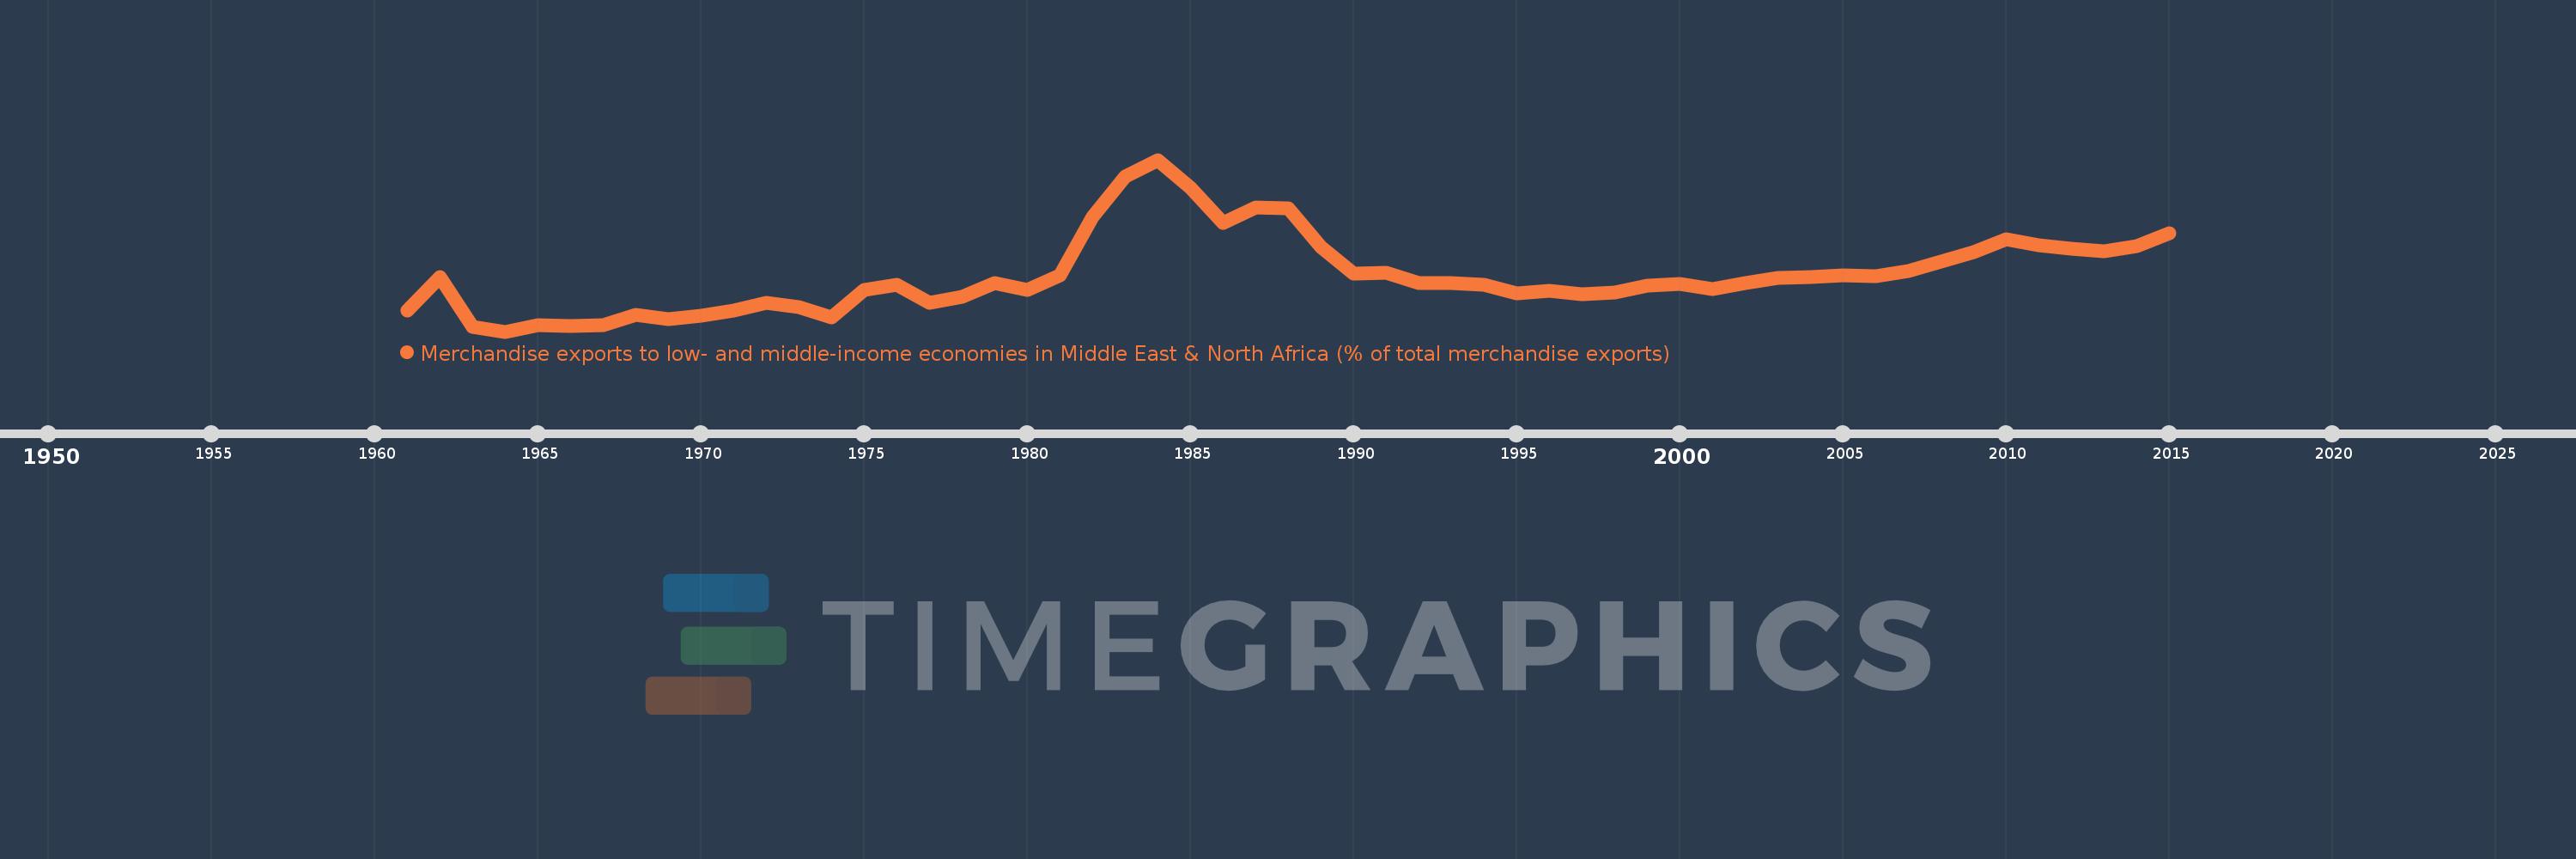
Merchandise exports to low- and middle-income economies in Middle East & North Africa (% of total merchandise exports)
2015,2014,2013,2012,2011,2010,2009,2008,2007,2006,2005,2004,2003,2002,2001,2000,1999,1998,1997,1996,1995,1994,1993,1992,1991,1990,1989,1988,1987,1986,1985,1984,1983,1982,1981,1980,1979,1978,1977,1976,1975,1974,1973,1972,1971,1970,1969,1968,1967,1966,1965,1964,1963,1962,1961
Estas estadísticas en otros países:
AfghanistanAlbaniaAlgeriaAngolaArab WorldArgentinaArmeniaArubaAustraliaAustriaAzerbaijanBahamas, TheBahrainBangladeshBarbadosBelarusBelgiumBelizeBeninBermudaBoliviaBosnia and HerzegovinaBrazilBrunei DarussalamBulgariaBurkina FasoBurundiCabo VerdeCambodiaCameroonCanadaCaribbean small statesCentral African RepublicCentral Europe and the BalticsChadChileChinaColombiaComorosCongo, Dem. Rep.Congo, Rep.Costa RicaCote d'IvoireCroatiaCubaCyprusCzech RepublicDenmarkDjiboutiDominicaDominican RepublicEarly-demographic dividendEast Asia & PacificEast Asia & Pacific (excluding high income)East Asia & Pacific (IDA & IBRD countries)EcuadorEgypt, Arab Rep.El SalvadorEquatorial GuineaEstoniaEthiopiaEuro areaEurope & Central AsiaEurope & Central Asia (excluding high income)Europe & Central Asia (IDA & IBRD countries)European UnionFijiFinlandFragile and conflict affected situationsFranceGabonGambia, TheGeorgiaGermanyGhanaGreeceGreenlandGrenadaGuatemalaGuineaGuinea-BissauGuyanaHaitiHeavily indebted poor countries (HIPC)High incomeHondurasHong Kong SAR, ChinaHungaryIBRD onlyIcelandIDA & IBRD totalIDA blendIDA onlyIDA totalIndiaIndonesiaIran, Islamic Rep.IraqIrelandIsraelItalyJamaicaJapanJordanKazakhstanKenyaKorea, Dem. People’s Rep.Korea, Rep.KosovoKuwaitKyrgyz RepublicLao PDRLate-demographic dividendLatin America & Caribbean Latin America & Caribbean (excluding high income)Latin America & the Caribbean (IDA & IBRD countries)LatviaLeast developed countries: UN classificationLebanonLiberiaLibyaLithuaniaLow & middle incomeLow incomeLower middle incomeLuxembourgMacao SAR, ChinaMacedonia, FYRMadagascarMalawiMalaysiaMaliMaltaMauritaniaMauritiusMexicoMiddle East & North AfricaMiddle East & North Africa (excluding high income)Middle East & North Africa (IDA & IBRD countries)Middle incomeMoldovaMongoliaMontenegroMoroccoMozambiqueMyanmarNepalNetherlandsNew CaledoniaNew ZealandNicaraguaNigerNigeriaNorth AmericaNorwayOECD membersOmanOther small statesPacific island small statesPakistanPanamaPapua New GuineaParaguayPeruPhilippinesPolandPortugalPost-demographic dividendPre-demographic dividendQatarRomaniaRussian FederationRwandaSamoaSaudi ArabiaSenegalSerbiaSeychellesSierra LeoneSingaporeSlovak RepublicSloveniaSmall statesSomaliaSouth AfricaSouth AsiaSouth Asia (IDA & IBRD)SpainSri LankaSt. LuciaSub-Saharan Africa Sub-Saharan Africa (excluding high income)Sub-Saharan Africa (IDA & IBRD countries)SudanSurinameSwedenSwitzerlandSyrian Arab RepublicTajikistanTanzaniaThailandTogoTrinidad and TobagoTunisiaTurkeyTurkmenistanUgandaUkraineUnited Arab EmiratesUnited KingdomUnited StatesUpper middle incomeUruguayUzbekistanVenezuela, RBVietnamWorldYemen, Rep.ZambiaZimbabwe línea de tiempo (timeline):
En esta escala de tiempo se presenta un gráfico de 1961 y 2015 de East Asia & Pacific (excluding high income). Los datos de 1960 están ausentes. El número de observaciones reales por fecha: 55.
Fuente (nombre):
Indicadores del desarrollo mundial
Fuente (organización):
World Bank staff estimates based data from International Monetary Fund's Direction of Trade database.
Categorías:
Private Sector, Trade
Se ha actualizado:
23 abr 2017 año
Los indicadores de los cambios de valor en los últimos años
Mínimo:
0.063
1 ene 1964 año
Máximo:
4.093
1 ene 1984 año
A la fecha de observación
Valor
Cambio absoluto
El cambio con respecto al valor anterior
1 ene 1961 año
0.566
+0.566
0.0%
1 ene 1962 año
1.34
+0.774
136.7%
1 ene 1963 año
0.171
-1.169
-87.23%
1 ene 1964 año
0.063
-0.109
-63.45%
1 ene 1965 año
0.224
+0.161
257.53%
1 ene 1966 año
0.19
-0.034
-15.1%
1 ene 1967 año
0.215
+0.025
13.37%
1 ene 1968 año
0.451
+0.236
109.62%
1 ene 1969 año
0.357
-0.094
-20.88%
1 ene 1970 año
0.436
+0.079
22.24%
1 ene 1971 año
0.549
+0.113
25.83%
1 ene 1972 año
0.745
+0.196
35.61%
1 ene 1973 año
0.634
-0.111
-14.85%
1 ene 1974 año
0.405
-0.229
-36.14%
1 ene 1975 año
1.05
+0.645
159.23%
1 ene 1976 año
1.164
+0.114
10.86%
1 ene 1977 año
0.748
-0.416
-35.73%
1 ene 1978 año
0.881
+0.133
17.82%
1 ene 1979 año
1.207
+0.326
37.04%
1 ene 1980 año
1.04
-0.167
-13.87%
1 ene 1981 año
1.385
+0.345
33.22%
1 ene 1982 año
2.753
+1.368
98.74%
1 ene 1983 año
3.703
+0.95
34.51%
1 ene 1984 año
4.093
+0.39
10.53%
1 ene 1985 año
3.444
-0.649
-15.86%
1 ene 1986 año
2.618
-0.826
-23.98%
1 ene 1987 año
2.967
+0.349
13.31%
1 ene 1988 año
2.945
-0.022
-0.74%
1 ene 1989 año
2.053
-0.892
-30.29%
1 ene 1990 año
1.433
-0.619
-30.17%
1 ene 1991 año
1.436
+0.002
0.17%
1 ene 1992 año
1.203
-0.233
-16.21%
1 ene 1993 año
1.208
+0.005
0.43%
1 ene 1994 año
1.155
-0.053
-4.41%
1 ene 1995 año
0.953
-0.202
-17.49%
1 ene 1996 año
1.016
+0.063
6.61%
1 ene 1997 año
0.936
-0.08
-7.84%
1 ene 1998 año
0.97
+0.034
3.6%
1 ene 1999 año
1.146
+0.176
18.18%
1 ene 2000 año
1.172
+0.026
2.28%
1 ene 2001 año
1.06
-0.112
-9.59%
1 ene 2002 año
1.194
+0.134
12.66%
1 ene 2003 año
1.327
+0.133
11.15%
1 ene 2004 año
1.345
+0.018
1.36%
1 ene 2005 año
1.375
+0.03
2.24%
1 ene 2006 año
1.359
-0.016
-1.2%
1 ene 2007 año
1.479
+0.12
8.84%
1 ene 2008 año
1.701
+0.223
15.04%
1 ene 2009 año
1.923
+0.222
13.03%
1 ene 2010 año
2.231
+0.308
16.01%
1 ene 2011 año
2.086
-0.145
-6.51%
1 ene 2012 año
2.012
-0.074
-3.55%
1 ene 2013 año
1.955
-0.057
-2.83%
1 ene 2014 año
2.07
+0.116
5.92%
1 ene 2015 año
2.367
+0.296
14.31%
Ranking de los países por los datos estadísticos actuales


Comentarios: