29
/es/
es
AIzaSyAYiBZKx7MnpbEhh9jyipgxe19OcubqV5w
April 1, 2024
190505
Mali
MLI
true
2
1
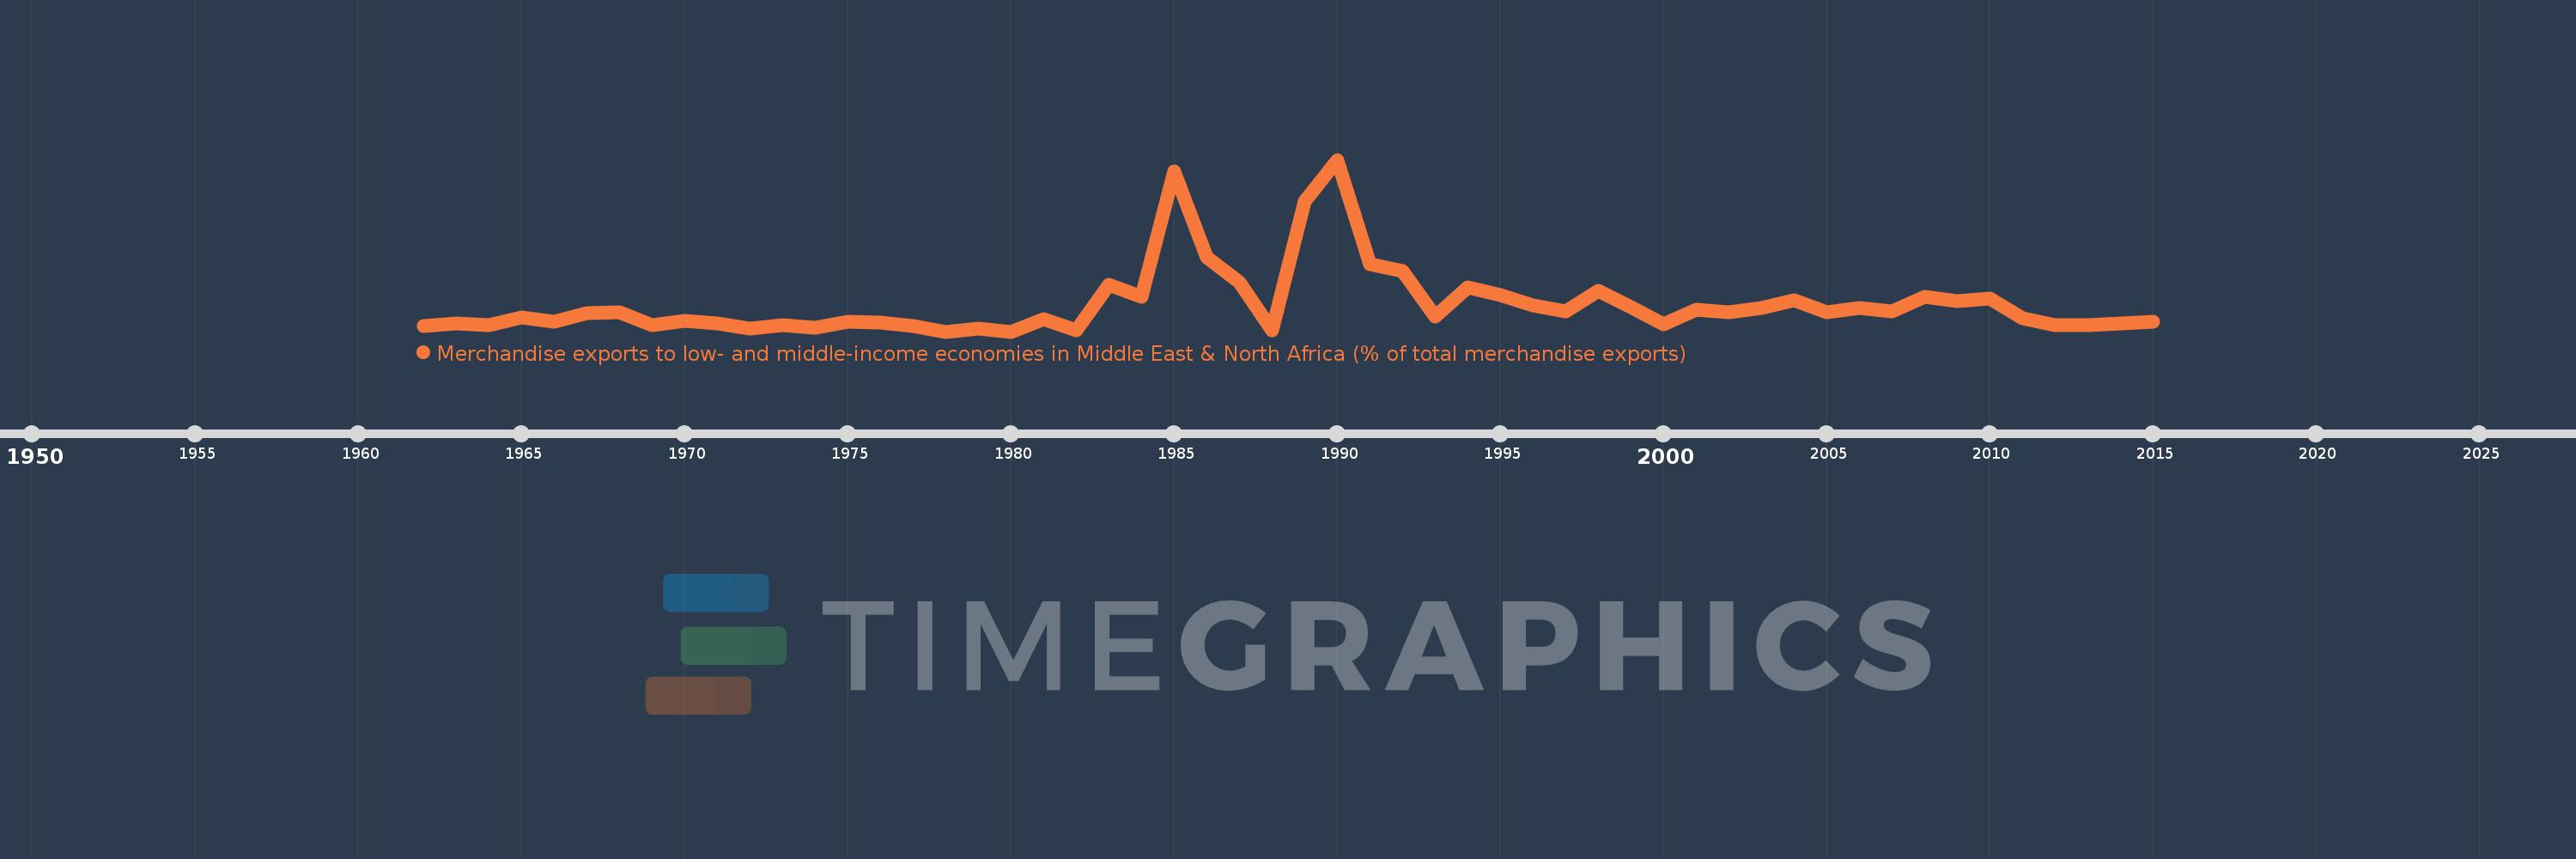
Merchandise exports to low- and middle-income economies in Middle East & North Africa (% of total merchandise exports)
2015,2014,2013,2012,2011,2010,2009,2008,2007,2006,2005,2004,2003,2002,2001,2000,1999,1998,1997,1996,1995,1994,1993,1992,1991,1990,1989,1988,1987,1986,1985,1984,1983,1982,1981,1980,1979,1978,1977,1976,1975,1974,1973,1972,1971,1970,1969,1968,1967,1966,1965,1964,1963,1962
Estas estadísticas en otros países:
AfghanistanAlbaniaAlgeriaAngolaArab WorldArgentinaArmeniaArubaAustraliaAustriaAzerbaijanBahamas, TheBahrainBangladeshBarbadosBelarusBelgiumBelizeBeninBermudaBoliviaBosnia and HerzegovinaBrazilBrunei DarussalamBulgariaBurkina FasoBurundiCabo VerdeCambodiaCameroonCanadaCaribbean small statesCentral African RepublicCentral Europe and the BalticsChadChileChinaColombiaComorosCongo, Dem. Rep.Congo, Rep.Costa RicaCote d'IvoireCroatiaCubaCyprusCzech RepublicDenmarkDjiboutiDominicaDominican RepublicEarly-demographic dividendEast Asia & PacificEast Asia & Pacific (excluding high income)East Asia & Pacific (IDA & IBRD countries)EcuadorEgypt, Arab Rep.El SalvadorEquatorial GuineaEstoniaEthiopiaEuro areaEurope & Central AsiaEurope & Central Asia (excluding high income)Europe & Central Asia (IDA & IBRD countries)European UnionFijiFinlandFragile and conflict affected situationsFranceGabonGambia, TheGeorgiaGermanyGhanaGreeceGreenlandGrenadaGuatemalaGuineaGuinea-BissauGuyanaHaitiHeavily indebted poor countries (HIPC)High incomeHondurasHong Kong SAR, ChinaHungaryIBRD onlyIcelandIDA & IBRD totalIDA blendIDA onlyIDA totalIndiaIndonesiaIran, Islamic Rep.IraqIrelandIsraelItalyJamaicaJapanJordanKazakhstanKenyaKorea, Dem. People’s Rep.Korea, Rep.KosovoKuwaitKyrgyz RepublicLao PDRLate-demographic dividendLatin America & Caribbean Latin America & Caribbean (excluding high income)Latin America & the Caribbean (IDA & IBRD countries)LatviaLeast developed countries: UN classificationLebanonLiberiaLibyaLithuaniaLow & middle incomeLow incomeLower middle incomeLuxembourgMacao SAR, ChinaMacedonia, FYRMadagascarMalawiMalaysiaMaliMaltaMauritaniaMauritiusMexicoMiddle East & North AfricaMiddle East & North Africa (excluding high income)Middle East & North Africa (IDA & IBRD countries)Middle incomeMoldovaMongoliaMontenegroMoroccoMozambiqueMyanmarNepalNetherlandsNew CaledoniaNew ZealandNicaraguaNigerNigeriaNorth AmericaNorwayOECD membersOmanOther small statesPacific island small statesPakistanPanamaPapua New GuineaParaguayPeruPhilippinesPolandPortugalPost-demographic dividendPre-demographic dividendQatarRomaniaRussian FederationRwandaSamoaSaudi ArabiaSenegalSerbiaSeychellesSierra LeoneSingaporeSlovak RepublicSloveniaSmall statesSomaliaSouth AfricaSouth AsiaSouth Asia (IDA & IBRD)SpainSri LankaSt. LuciaSub-Saharan Africa Sub-Saharan Africa (excluding high income)Sub-Saharan Africa (IDA & IBRD countries)SudanSurinameSwedenSwitzerlandSyrian Arab RepublicTajikistanTanzaniaThailandTogoTrinidad and TobagoTunisiaTurkeyTurkmenistanUgandaUkraineUnited Arab EmiratesUnited KingdomUnited StatesUpper middle incomeUruguayUzbekistanVenezuela, RBVietnamWorldYemen, Rep.ZambiaZimbabwe línea de tiempo (timeline):
En esta escala de tiempo se presenta un gráfico de 1962 y 2015 de Mali. Los datos de 1961 están ausentes. El número de observaciones reales por fecha: 54.
Fuente (nombre):
Indicadores del desarrollo mundial
Fuente (organización):
World Bank staff estimates based data from International Monetary Fund's Direction of Trade database.
Categorías:
Private Sector, Trade
Se ha actualizado:
23 abr 2017 año
Los indicadores de los cambios de valor en los últimos años
Máximo:
21.523
1 ene 1990 año
A la fecha de observación
Valor
Cambio absoluto
El cambio con respecto al valor anterior
1 ene 1962 año
0.714
+0.714
0.0%
1 ene 1963 año
0.99
+0.276
38.61%
1 ene 1964 año
0.802
-0.188
-18.99%
1 ene 1965 año
1.829
+1.027
128.06%
1 ene 1966 año
1.29
-0.539
-29.46%
1 ene 1967 año
2.308
+1.017
78.85%
1 ene 1968 año
2.439
+0.131
5.69%
1 ene 1969 año
0.791
-1.649
-67.59%
1 ene 1970 año
1.375
+0.584
73.93%
1 ene 1971 año
0.997
-0.378
-27.46%
1 ene 1972 año
0.379
-0.618
-61.96%
1 ene 1973 año
0.791
+0.411
108.42%
1 ene 1974 año
0.493
-0.297
-37.59%
1 ene 1975 año
1.199
+0.705
142.94%
1 ene 1976 año
1.18
-0.019
-1.6%
1 ene 1977 año
0.707
-0.472
-40.03%
1 ene 1978 año
0.0
-0.707
-100.0%
1 ene 1979 año
0.388
+0.388
%
1 ene 1980 año
0.0
-0.388
-100.0%
1 ene 1981 año
1.585
+1.585
%
1 ene 1982 año
0.2
-1.385
-87.35%
1 ene 1983 año
5.873
+5.673
2.83 mil%
1 ene 1984 año
4.309
-1.565
-26.64%
1 ene 1985 año
20.099
+15.791
366.5%
1 ene 1986 año
9.357
-10.742
-53.45%
1 ene 1987 año
6.157
-3.2
-34.2%
1 ene 1988 año
0.184
-5.973
-97.01%
1 ene 1989 año
16.357
+16.174
8.8 mil%
1 ene 1990 año
21.523
+5.165
31.58%
1 ene 1991 año
8.441
-13.082
-60.78%
1 ene 1992 año
7.602
-0.839
-9.94%
1 ene 1993 año
1.932
-5.67
-74.58%
1 ene 1994 año
5.545
+3.613
187.0%
1 ene 1995 año
4.581
-0.964
-17.39%
1 ene 1996 año
3.33
-1.251
-27.31%
1 ene 1997 año
2.577
-0.753
-22.62%
1 ene 1998 año
5.068
+2.491
96.67%
1 ene 1999 año
3.062
-2.006
-39.58%
1 ene 2000 año
0.866
-2.197
-71.73%
1 ene 2001 año
2.738
+1.872
216.31%
1 ene 2002 año
2.4
-0.338
-12.35%
1 ene 2003 año
2.978
+0.578
24.08%
1 ene 2004 año
3.915
+0.938
31.48%
1 ene 2005 año
2.383
-1.532
-39.13%
1 ene 2006 año
2.999
+0.616
25.86%
1 ene 2007 año
2.542
-0.457
-15.24%
1 ene 2008 año
4.4
+1.858
73.07%
1 ene 2009 año
3.815
-0.586
-13.31%
1 ene 2010 año
4.133
+0.318
8.34%
1 ene 2011 año
1.64
-2.493
-60.31%
1 ene 2012 año
0.854
-0.786
-47.92%
1 ene 2013 año
0.85
-0.004
-0.5%
1 ene 2014 año
1.06
+0.21
24.74%
1 ene 2015 año
1.198
+0.138
13.0%
Ranking de los países por los datos estadísticos actuales


Comentarios: