29
/es/
es
AIzaSyAYiBZKx7MnpbEhh9jyipgxe19OcubqV5w
April 1, 2024
286165
Zambia
ZMB
true
2
1
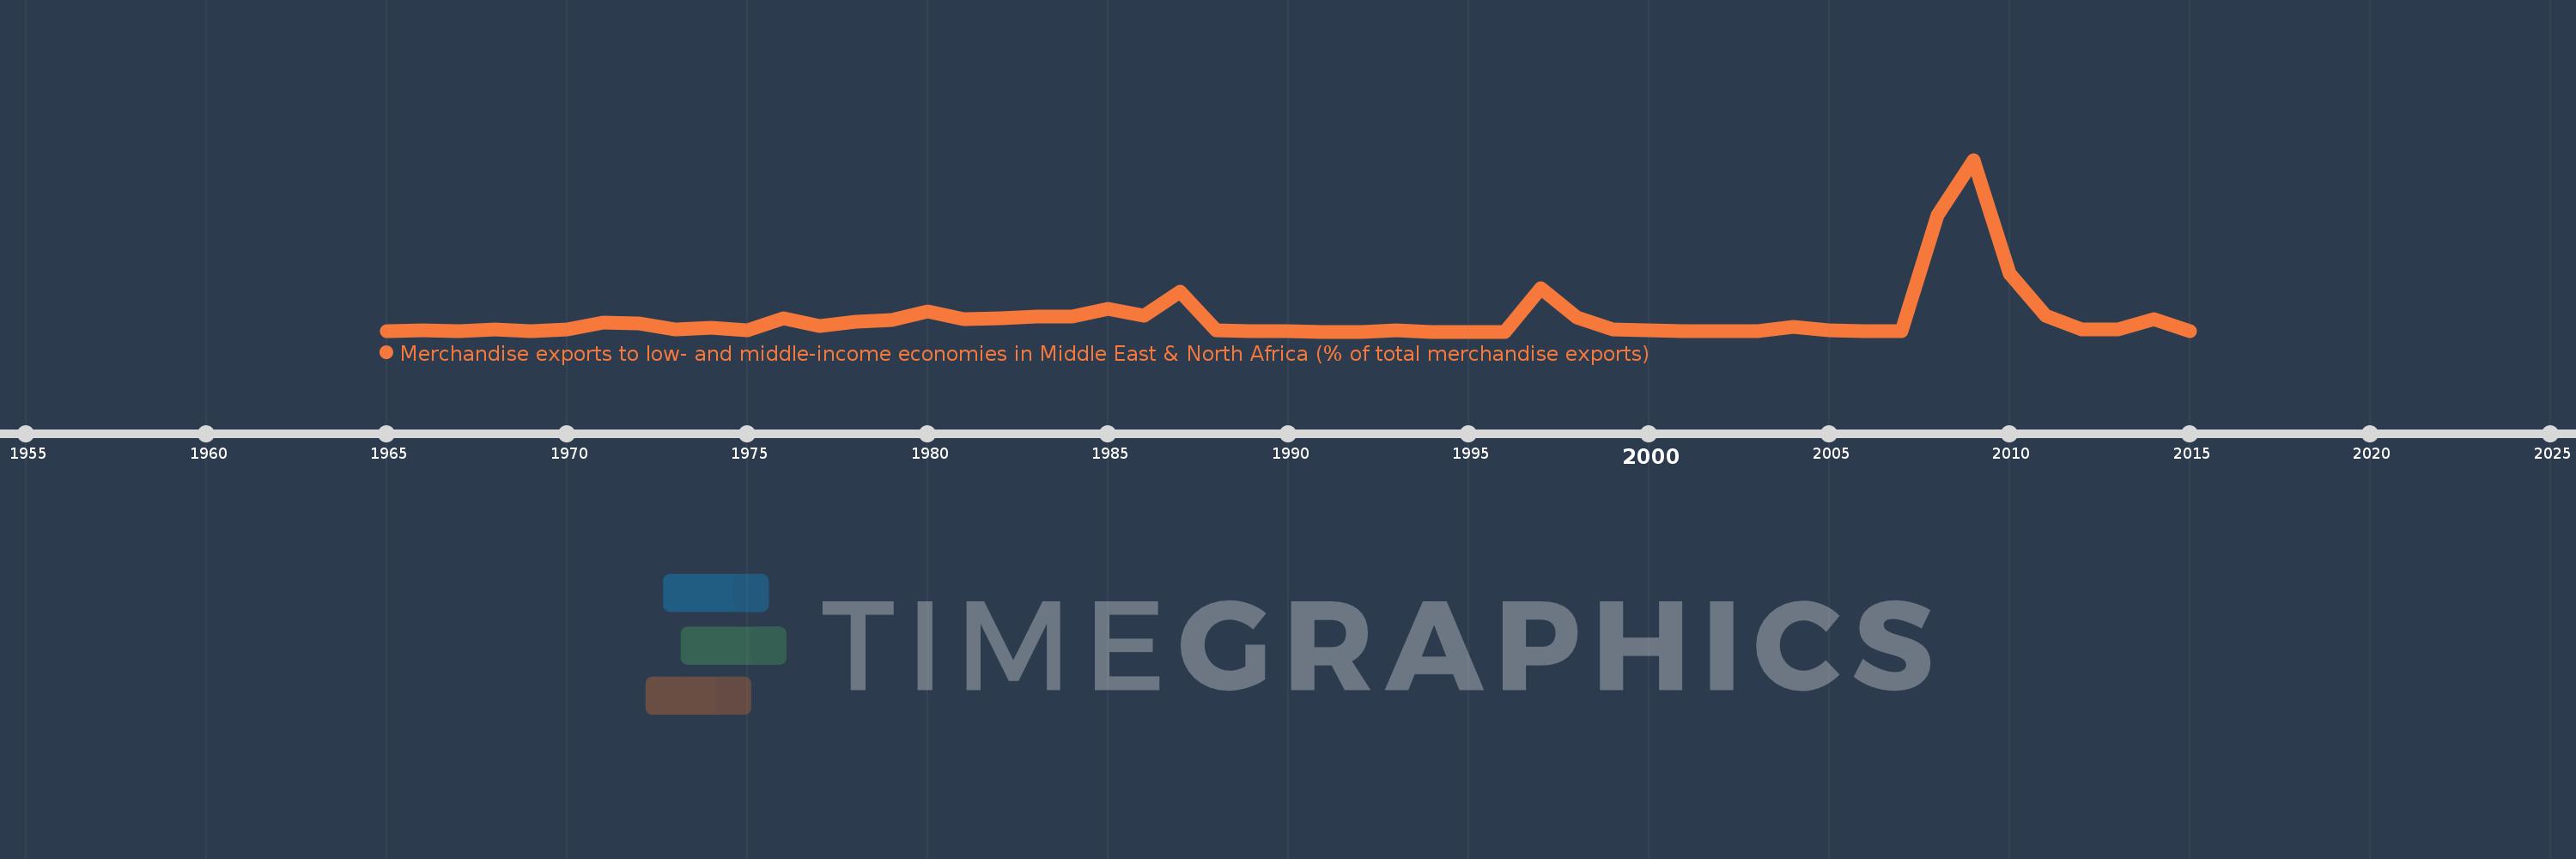
Merchandise exports to low- and middle-income economies in Middle East & North Africa (% of total merchandise exports)
2015,2014,2013,2012,2011,2010,2009,2008,2007,2006,2005,2004,2003,2002,2001,2000,1999,1998,1997,1996,1995,1994,1993,1992,1991,1990,1989,1988,1987,1986,1985,1984,1983,1982,1981,1980,1979,1978,1977,1976,1975,1974,1973,1972,1971,1970,1969,1968,1967,1966,1965
Estas estadísticas en otros países:
AfghanistanAlbaniaAlgeriaAngolaArab WorldArgentinaArmeniaArubaAustraliaAustriaAzerbaijanBahamas, TheBahrainBangladeshBarbadosBelarusBelgiumBelizeBeninBermudaBoliviaBosnia and HerzegovinaBrazilBrunei DarussalamBulgariaBurkina FasoBurundiCabo VerdeCambodiaCameroonCanadaCaribbean small statesCentral African RepublicCentral Europe and the BalticsChadChileChinaColombiaComorosCongo, Dem. Rep.Congo, Rep.Costa RicaCote d'IvoireCroatiaCubaCyprusCzech RepublicDenmarkDjiboutiDominicaDominican RepublicEarly-demographic dividendEast Asia & PacificEast Asia & Pacific (excluding high income)East Asia & Pacific (IDA & IBRD countries)EcuadorEgypt, Arab Rep.El SalvadorEquatorial GuineaEstoniaEthiopiaEuro areaEurope & Central AsiaEurope & Central Asia (excluding high income)Europe & Central Asia (IDA & IBRD countries)European UnionFijiFinlandFragile and conflict affected situationsFranceGabonGambia, TheGeorgiaGermanyGhanaGreeceGreenlandGrenadaGuatemalaGuineaGuinea-BissauGuyanaHaitiHeavily indebted poor countries (HIPC)High incomeHondurasHong Kong SAR, ChinaHungaryIBRD onlyIcelandIDA & IBRD totalIDA blendIDA onlyIDA totalIndiaIndonesiaIran, Islamic Rep.IraqIrelandIsraelItalyJamaicaJapanJordanKazakhstanKenyaKorea, Dem. People’s Rep.Korea, Rep.KosovoKuwaitKyrgyz RepublicLao PDRLate-demographic dividendLatin America & Caribbean Latin America & Caribbean (excluding high income)Latin America & the Caribbean (IDA & IBRD countries)LatviaLeast developed countries: UN classificationLebanonLiberiaLibyaLithuaniaLow & middle incomeLow incomeLower middle incomeLuxembourgMacao SAR, ChinaMacedonia, FYRMadagascarMalawiMalaysiaMaliMaltaMauritaniaMauritiusMexicoMiddle East & North AfricaMiddle East & North Africa (excluding high income)Middle East & North Africa (IDA & IBRD countries)Middle incomeMoldovaMongoliaMontenegroMoroccoMozambiqueMyanmarNepalNetherlandsNew CaledoniaNew ZealandNicaraguaNigerNigeriaNorth AmericaNorwayOECD membersOmanOther small statesPacific island small statesPakistanPanamaPapua New GuineaParaguayPeruPhilippinesPolandPortugalPost-demographic dividendPre-demographic dividendQatarRomaniaRussian FederationRwandaSamoaSaudi ArabiaSenegalSerbiaSeychellesSierra LeoneSingaporeSlovak RepublicSloveniaSmall statesSomaliaSouth AfricaSouth AsiaSouth Asia (IDA & IBRD)SpainSri LankaSt. LuciaSub-Saharan Africa Sub-Saharan Africa (excluding high income)Sub-Saharan Africa (IDA & IBRD countries)SudanSurinameSwedenSwitzerlandSyrian Arab RepublicTajikistanTanzaniaThailandTogoTrinidad and TobagoTunisiaTurkeyTurkmenistanUgandaUkraineUnited Arab EmiratesUnited KingdomUnited StatesUpper middle incomeUruguayUzbekistanVenezuela, RBVietnamWorldYemen, Rep.ZambiaZimbabwe línea de tiempo (timeline):
En esta escala de tiempo se presenta un gráfico de 1965 y 2015 de Zambia. Los datos de 1964 están ausentes. El número de observaciones reales por fecha: 51.
Fuente (nombre):
Indicadores del desarrollo mundial
Fuente (organización):
World Bank staff estimates based data from International Monetary Fund's Direction of Trade database.
Categorías:
Private Sector, Trade
Se ha actualizado:
23 abr 2017 año
Los indicadores de los cambios de valor en los últimos años
Máximo:
7.568
1 ene 2009 año
A la fecha de observación
Valor
Cambio absoluto
El cambio con respecto al valor anterior
1 ene 1965 año
0.037
+0.037
0.0%
1 ene 1966 año
0.038
+0.0
1.02%
1 ene 1967 año
0.014
-0.023
-61.47%
1 ene 1968 año
0.11
+0.096
659.98%
1 ene 1969 año
0.013
-0.097
-88.06%
1 ene 1970 año
0.089
+0.076
580.54%
1 ene 1971 año
0.412
+0.322
360.32%
1 ene 1972 año
0.374
-0.038
-9.3%
1 ene 1973 año
0.109
-0.265
-70.95%
1 ene 1974 año
0.161
+0.053
48.49%
1 ene 1975 año
0.074
-0.087
-54.2%
1 ene 1976 año
0.571
+0.497
673.49%
1 ene 1977 año
0.263
-0.308
-53.93%
1 ene 1978 año
0.435
+0.172
65.57%
1 ene 1979 año
0.517
+0.082
18.76%
1 ene 1980 año
0.886
+0.369
71.34%
1 ene 1981 año
0.534
-0.352
-39.74%
1 ene 1982 año
0.605
+0.071
13.37%
1 ene 1983 año
0.653
+0.048
7.85%
1 ene 1984 año
0.653
0.0
0.0%
1 ene 1985 año
0.992
+0.339
51.94%
1 ene 1986 año
0.682
-0.31
-31.2%
1 ene 1987 año
1.777
+1.094
160.34%
1 ene 1988 año
0.061
-1.715
-96.55%
1 ene 1989 año
0.001
-0.06
-97.71%
1 ene 1990 año
0.001
0.0
-25.29%
1 ene 1991 año
0.0
-0.001
-100.0%
1 ene 1993 año
0.046
+0.046
%
1 ene 1994 año
0.0
-0.046
-100.0%
1 ene 1997 año
1.918
+1.917
942.28 mil%
1 ene 1998 año
0.643
-1.275
-66.47%
1 ene 1999 año
0.099
-0.544
-84.56%
1 ene 2000 año
0.041
-0.058
-58.9%
1 ene 2001 año
0.024
-0.017
-41.36%
1 ene 2002 año
0.009
-0.015
-61.19%
1 ene 2003 año
0.037
+0.027
294.24%
1 ene 2004 año
0.21
+0.173
473.63%
1 ene 2005 año
0.054
-0.156
-74.15%
1 ene 2006 año
0.024
-0.031
-56.29%
1 ene 2007 año
0.017
-0.007
-30.2%
1 ene 2008 año
5.145
+5.129
30.96 mil%
1 ene 2009 año
7.568
+2.423
47.09%
1 ene 2010 año
2.572
-4.997
-66.02%
1 ene 2011 año
0.687
-1.885
-73.29%
1 ene 2012 año
0.088
-0.599
-87.21%
1 ene 2013 año
0.092
+0.004
5.01%
1 ene 2014 año
0.546
+0.453
491.21%
1 ene 2015 año
0.003
-0.543
-99.53%
Ranking de los países por los datos estadísticos actuales


Comentarios: